Abstract
As in other western cities, the fast-paced urban, industrial, and commercial sprawl
of Paris during the 19th century provided the backdrop and driving force for the
publishing phenomenon of trade directories. We show how these collections of millions
of nominative entries associated with addresses can be turned into a serial dataset
whose massive, fine-grained, and geolocated nature opens up new possibilities for
quantitative and multi-scale analyses of the dynamics at play during one of the most
dramatic socio-spatial transformations of the city. We highlight the methodological
conditions of such data-driven analyses and emphasize the importance of understanding
source effects. The findings underscore the significance of data science in
critically evaluating digital sources and adhering to best practices in the
production of large historical datasets.
1. Introduction
City directories are extensive lists of residents, shops, businesses, and
institutions, with a description of their professional or commercial activity and
an
address to locate them. They became a widespread publishing phenomenon in Europe and
the USA during the 19th century, subsequent to the introduction of house numbering
in
the 18th century [
Tantner 2009]
[
Rose-Redwood and Tantner 2012]
[
Albers and Kappner 2023]. The primary purpose of directories was to facilitate
business relations between people, whether through written correspondence or by
visiting the listed address. Published at a rapid pace (often annually) throughout
the 19th and 20th centuries, they form sequences of highly detailed snapshots of the
economic activities taking place in a city. They are a highly fine-grained source
of
information for interdisciplinary studies of cities, as well as for specialized
fields research such as urban studies and historical economics [
di Leonardo et al. 2019]
[
Bell et al. 2020]. Yet their potential for quantitative historical studies
is vastly under-exploited, due to the extensive transcription, geocoding and
structuring operations required to transform them into digital databases.
In the research project SoDUCo, we developed an automatic pipeline to extract,
semantically annotate, geocode, and structure 144 directories of Paris published
between 1787 and 1914. This process involved image segmentation to detect entries,
OCR for text extraction, named entity recognition and geocoding to assign geographic
positions to the addresses in directory entries, resulting in an open dataset of
about 23 million records [
GeoHistoricalData 2023].
The spatial and social dynamics of European cities in the 19th century are
characterized by growth, sprawl, and socio-economic transformations as a result of
industrialization. Growth and sprawl dynamics have been mainly investigated using
demographic sources, dependent on census rationale and administrative boundaries,
or
getting morphological information from city plans. Both types of sources are less
detailed than directories in terms of spatial and temporal scale.
For the first time, it is possible to study the dynamics of a European capital at
a
key moment in its history, with unprecedented spatio-temporal resolution and extent:
address-level information for the whole city, roughly every year over more than a
century. Adopting a data-driven geography perspective, we demonstrate that the Paris
directories dataset is a valuable multi-scale and multi-granularity (spatial and
temporal) research tool for analyzing the city’s urban growth throughout the 19th
century. However, such a massive digital dataset can mask many biases and source
effects. We show that an expert examination of the directories, and their extracted
and geocoded content, helps to better understand the dynamics at work in the city’s
urbanizing margins.
Paris changed a lot between 1787 and 1914. Demographic growth is considerable, rising
from an estimated 593k inhabitants in 1780 to around 2.9M in 1911 [
Brée 2020]
[
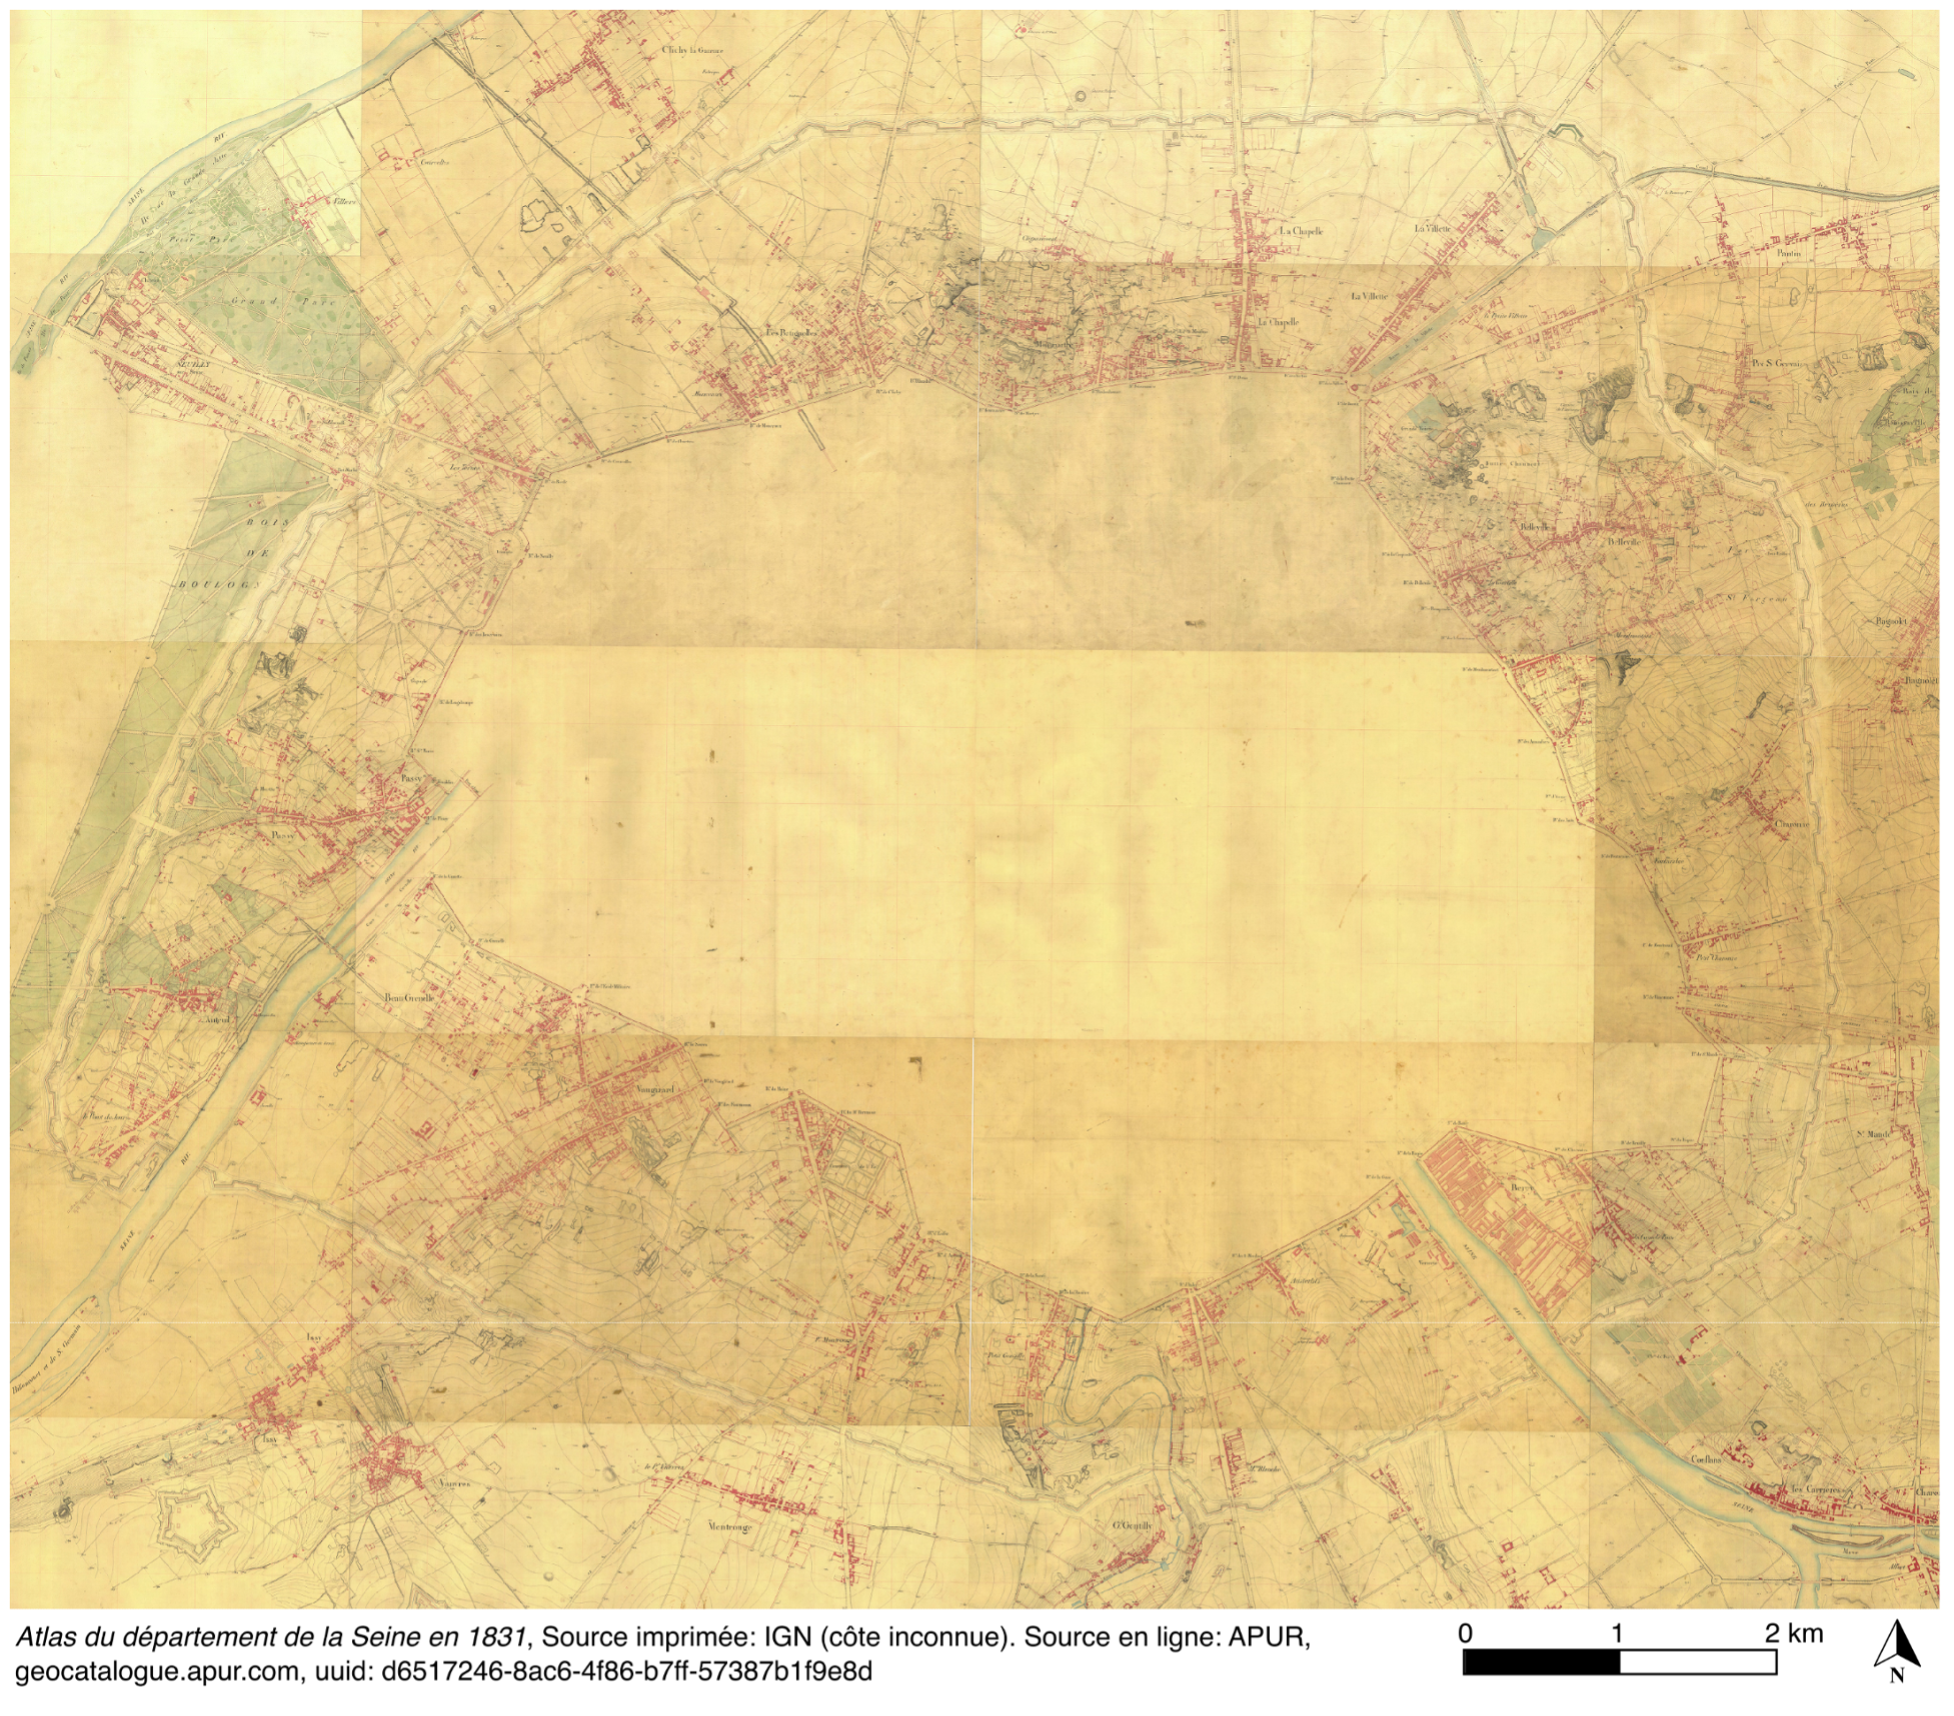
Varet-Vitu, Marraud, and Mermet 2020], partly combined with strong urban sprawl. Major
planning policies have led to significant transformations in the urban fabric that
affected the organization of the city, house numbering and street naming. Haussmann’s
renovation (1853-1870) dramatically reshaped entire parts of the city, while the
merging of all neighboring municipalities following the 1859 law on the extension
of
Paris, abruptly doubled the city administrative area in 1860 [
Jordan 1995]
[
Montel 2012]. Until then, the municipal territory was bounded by the
Fermiers généraux wall
[1]
(Figure 1, delineation of the blank area). The division of Paris into districts and
arrondissements was completely revised when the administrative area was extended to
the Thiers wall in 1860. Built between 1841 and 1844, this fortified belt is already
planned on the map of Figure 1 dating from 1831. The red-lavished built-up areas
already stretch along the main roads that connect the city to the surrounding
networks beyond its administrative boundaries.
The study of urban fabric depends on the ability to map directory entries in
geographic space on the basis of the addresses they contain. This operation, known
as
geocoding, is essential and requires precise knowledge of the evolution of the urban
fabric of Paris, in particular the numbering of buildings and houses.
The introduction of systematic house numbering in European and American cities during
the 18th century reflected the emergence of a regulatory and rationalist vision of
municipal administrations in their territories [
Rose-Redwood and Tantner 2012].
The first
[2] systematic numbering of all buildings in Paris was attempted by the
revolutionary administration in 1790, only to be replaced in 1805 by a numbering
based on a standardized set of rules still in place today. Although the system
stabilized from 1805 onward, Paris’ growth and densification caused frequent changes
in the numbering, throughout the 19th century. Despite this instability, it is
notable that residents quickly adopt the numbering system as a way of locating
themselves in the city [
Denis 2015].
Our paper is structured into five sections. We begin with a literature review on
geocoding strategies in historical spaces, with a focus on Paris (Section 2). We then
present the directories editors’ conception of the city of Paris and the corpus
constituted to study the dynamics of the Parisian urban fabric (Section 3). In the
following methodological section, we explain how we apprehend the urban fabric
through density analysis of distinct geolocated address points in directories
(Section 4). We demonstrate that these address points serve as a reliable proxy of
the Parisian urban fabric, allowing us to analyze urban sprawl, de-densification of
the center, and local densification trajectories between 1822 and 1914 through a
data-driven geographic approach (Section 5). Finally, we discuss the challenges of
capturing urban margins and the choices made in transcribing and enriching Paris
directories, highlighting best practices and emphasizing the role of data science
in
critically assessing this large digital source (Section 6).
2. Literature review: Geocoding addresses in historical spaces
If directory entries can be systematically located in urban space through addresses,
enabling spatial and spatio-temporal analysis, it is necessary to translate the
addresses into precise geographical coordinates — in short, to geocode them.
Geocoding, whether automated or manual, is a standard data preparation step in
quantitative social sciences that focus on the spatial dimension of phenomena.
However, it can introduce significant bias in spatial analysis [
Zandbergen 2009] and presents a methodological challenge for fields
relying on statistical methods and large-scale, fine-grained data, particularly at
the individual level, such as health research and historical demography [
Delmelle et al. 2022]. A notable example is the study of [
Hedefalk et al. 2018], analyzing how geocoding strategies affect spatial
analyses of the relationships between population density, proximity to wetlands, and
mortality rates in Swedish parishes (1850–1914). Their study shows a significant
underestimation of mortality and a weakening of statistical significance when the
granularity of the geodata supporting the geocoding is coarser than that of the
demographic data recorded at parcel level.
While in many geohistorical studies geocoding is done manually, e.g. using GIS
software, here we focus on its automation using software tools called “geocoders”, which are the only reasonable option for handling
large datasets. Geocoders are search engines capable of returning the geographic
coordinates of a place from a textual reference to that place, such as a postal
address, based on a reference geospatial database. Geocoding historical data presents
its own challenges, as it often requires a database adapted to the period and region
under study. There are three general strategies for historical geocoding, depending
on the level of detail required, the scale of analysis, and the availability of
geospatial data sources.
One strategy involves either the direct use of contemporary on-the-shelf geocoding
services such as Nominatim or ArcGIS [
Pearce et al. 2018], or the development
of geocoding tools that leverage contemporary gazetteers and knowledge bases like
Geonames or DBPedia [
Åhlfeldt, Berman, and Wick 2016]. This is well suited to small
datasets where the time gap between the historical data and the geocoder reference
database is reduced. However, an extensive step of manual inspection and correction
is often required to ensure consistent and reliable results, as the lack of
synchronicity between the geocoder and the queries can lead to a high false positive
rate. Some proposals incorporate heuristics to reduce uncertainty and errors, e.g.
by
reducing the search area considered for each query [
Daras, Feng, and Dibben 2015].
A second strategy is to build custom geocoders for historical data which combine
multiple gazetteers, either loosely coupled [
Mertel et al. 2021] or fully
integrated in a single database [
Cura et al. 2018]. Efforts are concentrated
on creating a historical reference database for the geocoder, extracting data in
historical sources like maps, or integrating existing historical geodatasets. The
goal is to create a geocoding process that fits the case study to achieve better
consistency while still being able to deal with large scale and fine-grained data.
The main drawback being the cost of building the reference data, but these approaches
tend to favor open data pooling and crowdsourcing to build large historical
gazetteers [
Grossner and Mostern 2021].
The third hybrid strategy aims to get the best of both worlds by coupling large,
up-to-date geographic databases with specialized historical gazetteers. For example,
to locate historical census addresses from 1901 in England and Wales, [
Lan and Longley 2019] use a lower granularity historical gazetteer as a fallback to
geocoding on the Ordnance Survey address database
The dramatic instability of Paris address numbers over the 19th century precludes
anachronistic geospatial references as a geocoding support and calls for the use of
address geodatabases contemporary with the directories (see Appendix 8.1).
3. Dataset: The alphabetical address lists of Parisian directories
Challenges arise with the Parisian directories corpus due to its construction from
sources spanning over a long time period. Changes in political, technical,
economical, and social contexts affect how companies edit directory collections and
display their content. As a result, the internal organization of directories evolves
over time, as does their social coverage. We present the corpus compiled for this
paper (3.1.) and then show that editors had conceived Parisian space in terms of
socio-economic functioning (3.2.).
3.1. Compilation of the study corpus
We did a systematic chronological inventory of the directories of Paris between
1780 and 1914 during the SoDUCo project [
Baciocchi and Cristofoli 2022]
[
Cristofoli and Baciocci 2024]. Building on the seminal work of Jeanne Pronteau
(1966) and the French National Library catalog, we identified 341 books, organized
into 57 series, which are grouped into 24 collections [
Pronteau 1966]. We created a detailed inventory containing information on the content,
structure, and quality of digitization
[3] of the 166 copies that have been digitized and openly published.
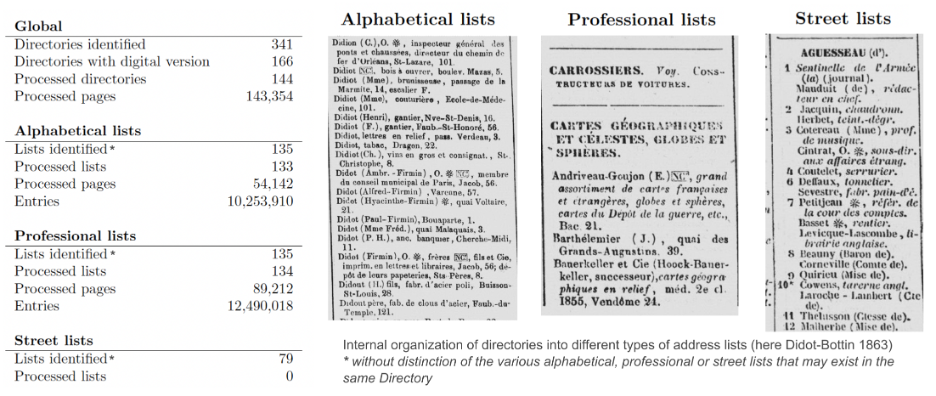
Directory address lists typically follow three formats: alphabetical, by
profession, and by street (see Figure 2) to facilitate searching for readers of
the time. Paris directories list a wide variety of individuals: diverse merchants,
craftsmen, manufacturers, doctors, midwifes, lawyers, bankers, owners, annuitants,
etc. The lists and their content, however, changed over time. Until the late
1810s, alphabetical lists included prominent inhabitants, while professional lists
featured merchants. After that, alphabetical lists began to combine both
categories. From 1903 onward, the editors of the Didot-Bottin moved prominent
residents into a separate directory entitled
Bottin mondain
[
Firmin-Didot and Firmin-Didot 1903].
We selected directories approximately five years to study urban sprawl and
densification. We assume this temporal resolution to be precise enough to capture
city-scale dynamics while keeping the dataset to a reasonable size. The selection
of specific years is however a compromise between methodological choices and
practical constraints, such as digitization quality or our desire to study a
common collection of directories, since they are more comparable with each other
than directories from different collections (see Appendix 8.2).
3.2. Parisian space as conceived by editors: A functional definition of the
city
Editors never explain their conception of Paris and its limits. As an example, the
prospectus for the directory published by Bottin in 1820 describes the
organization of the book as follows:
“The Almanach du Commerce
presents three main divisions: 1° Paris; 2° French departments and colonies; 3°
foreign countries. The first division, Paris, alone occupies two-fifths of the
volume, and begins with lists of the capital’s merchants”
[
Bottin 1820, prospectus, our translation]. In a lengthy
paragraph, Sébastien Bottin explains the major changes he has made to the
nomenclatures of the lists and the cross-referencing systems, compared with the
lists published by Jean de La Tynna two years earlier, but he is silent on his
conception of the delimitation of Paris.
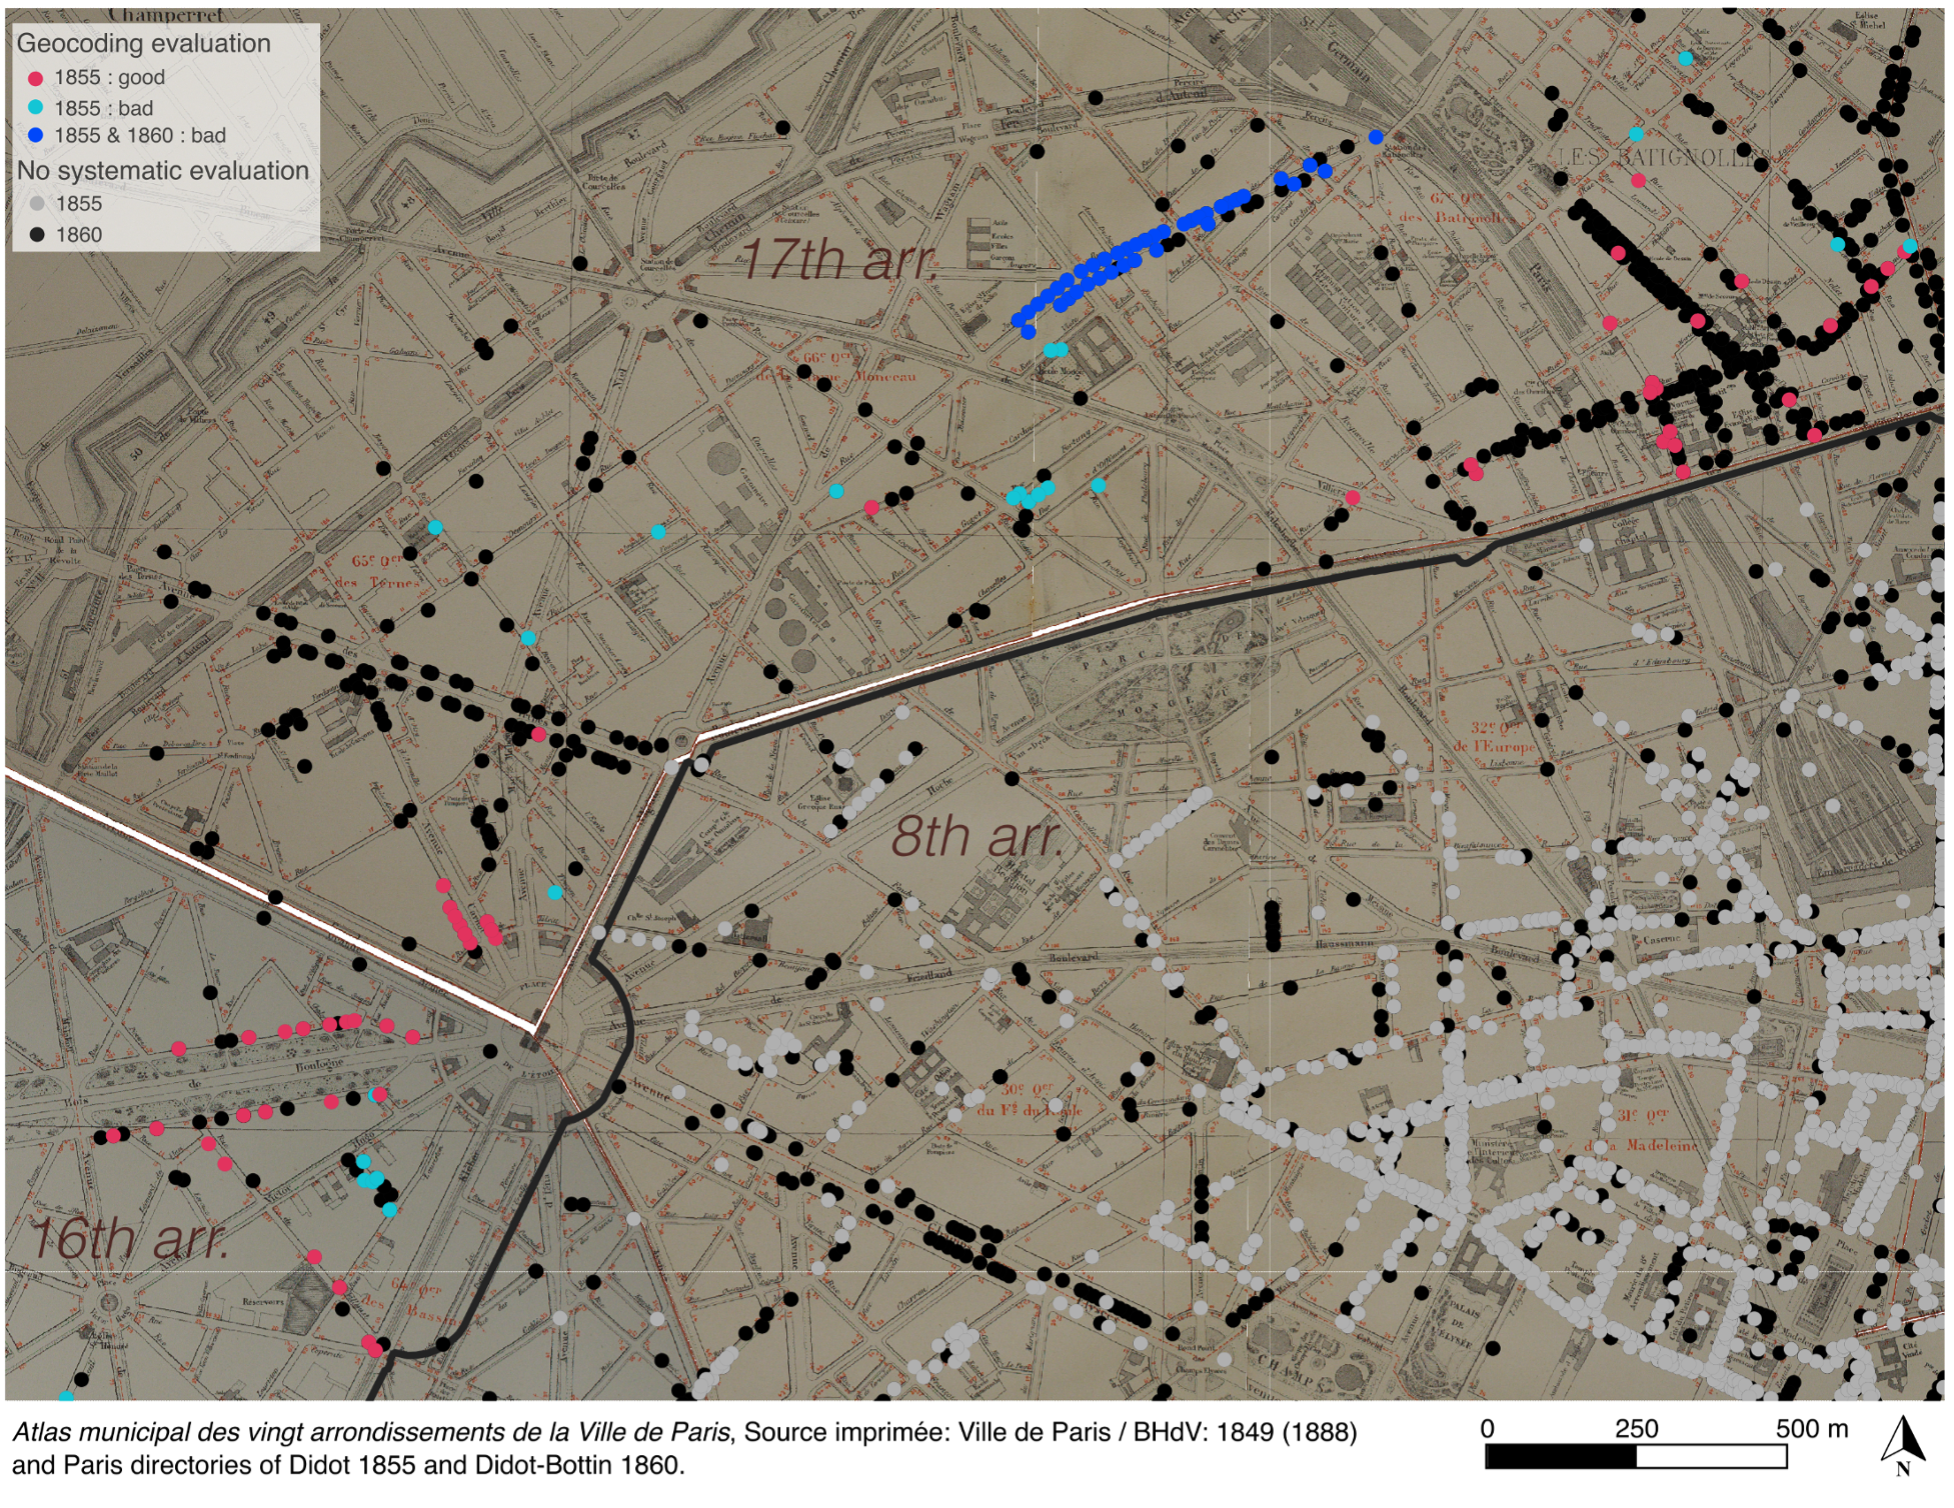
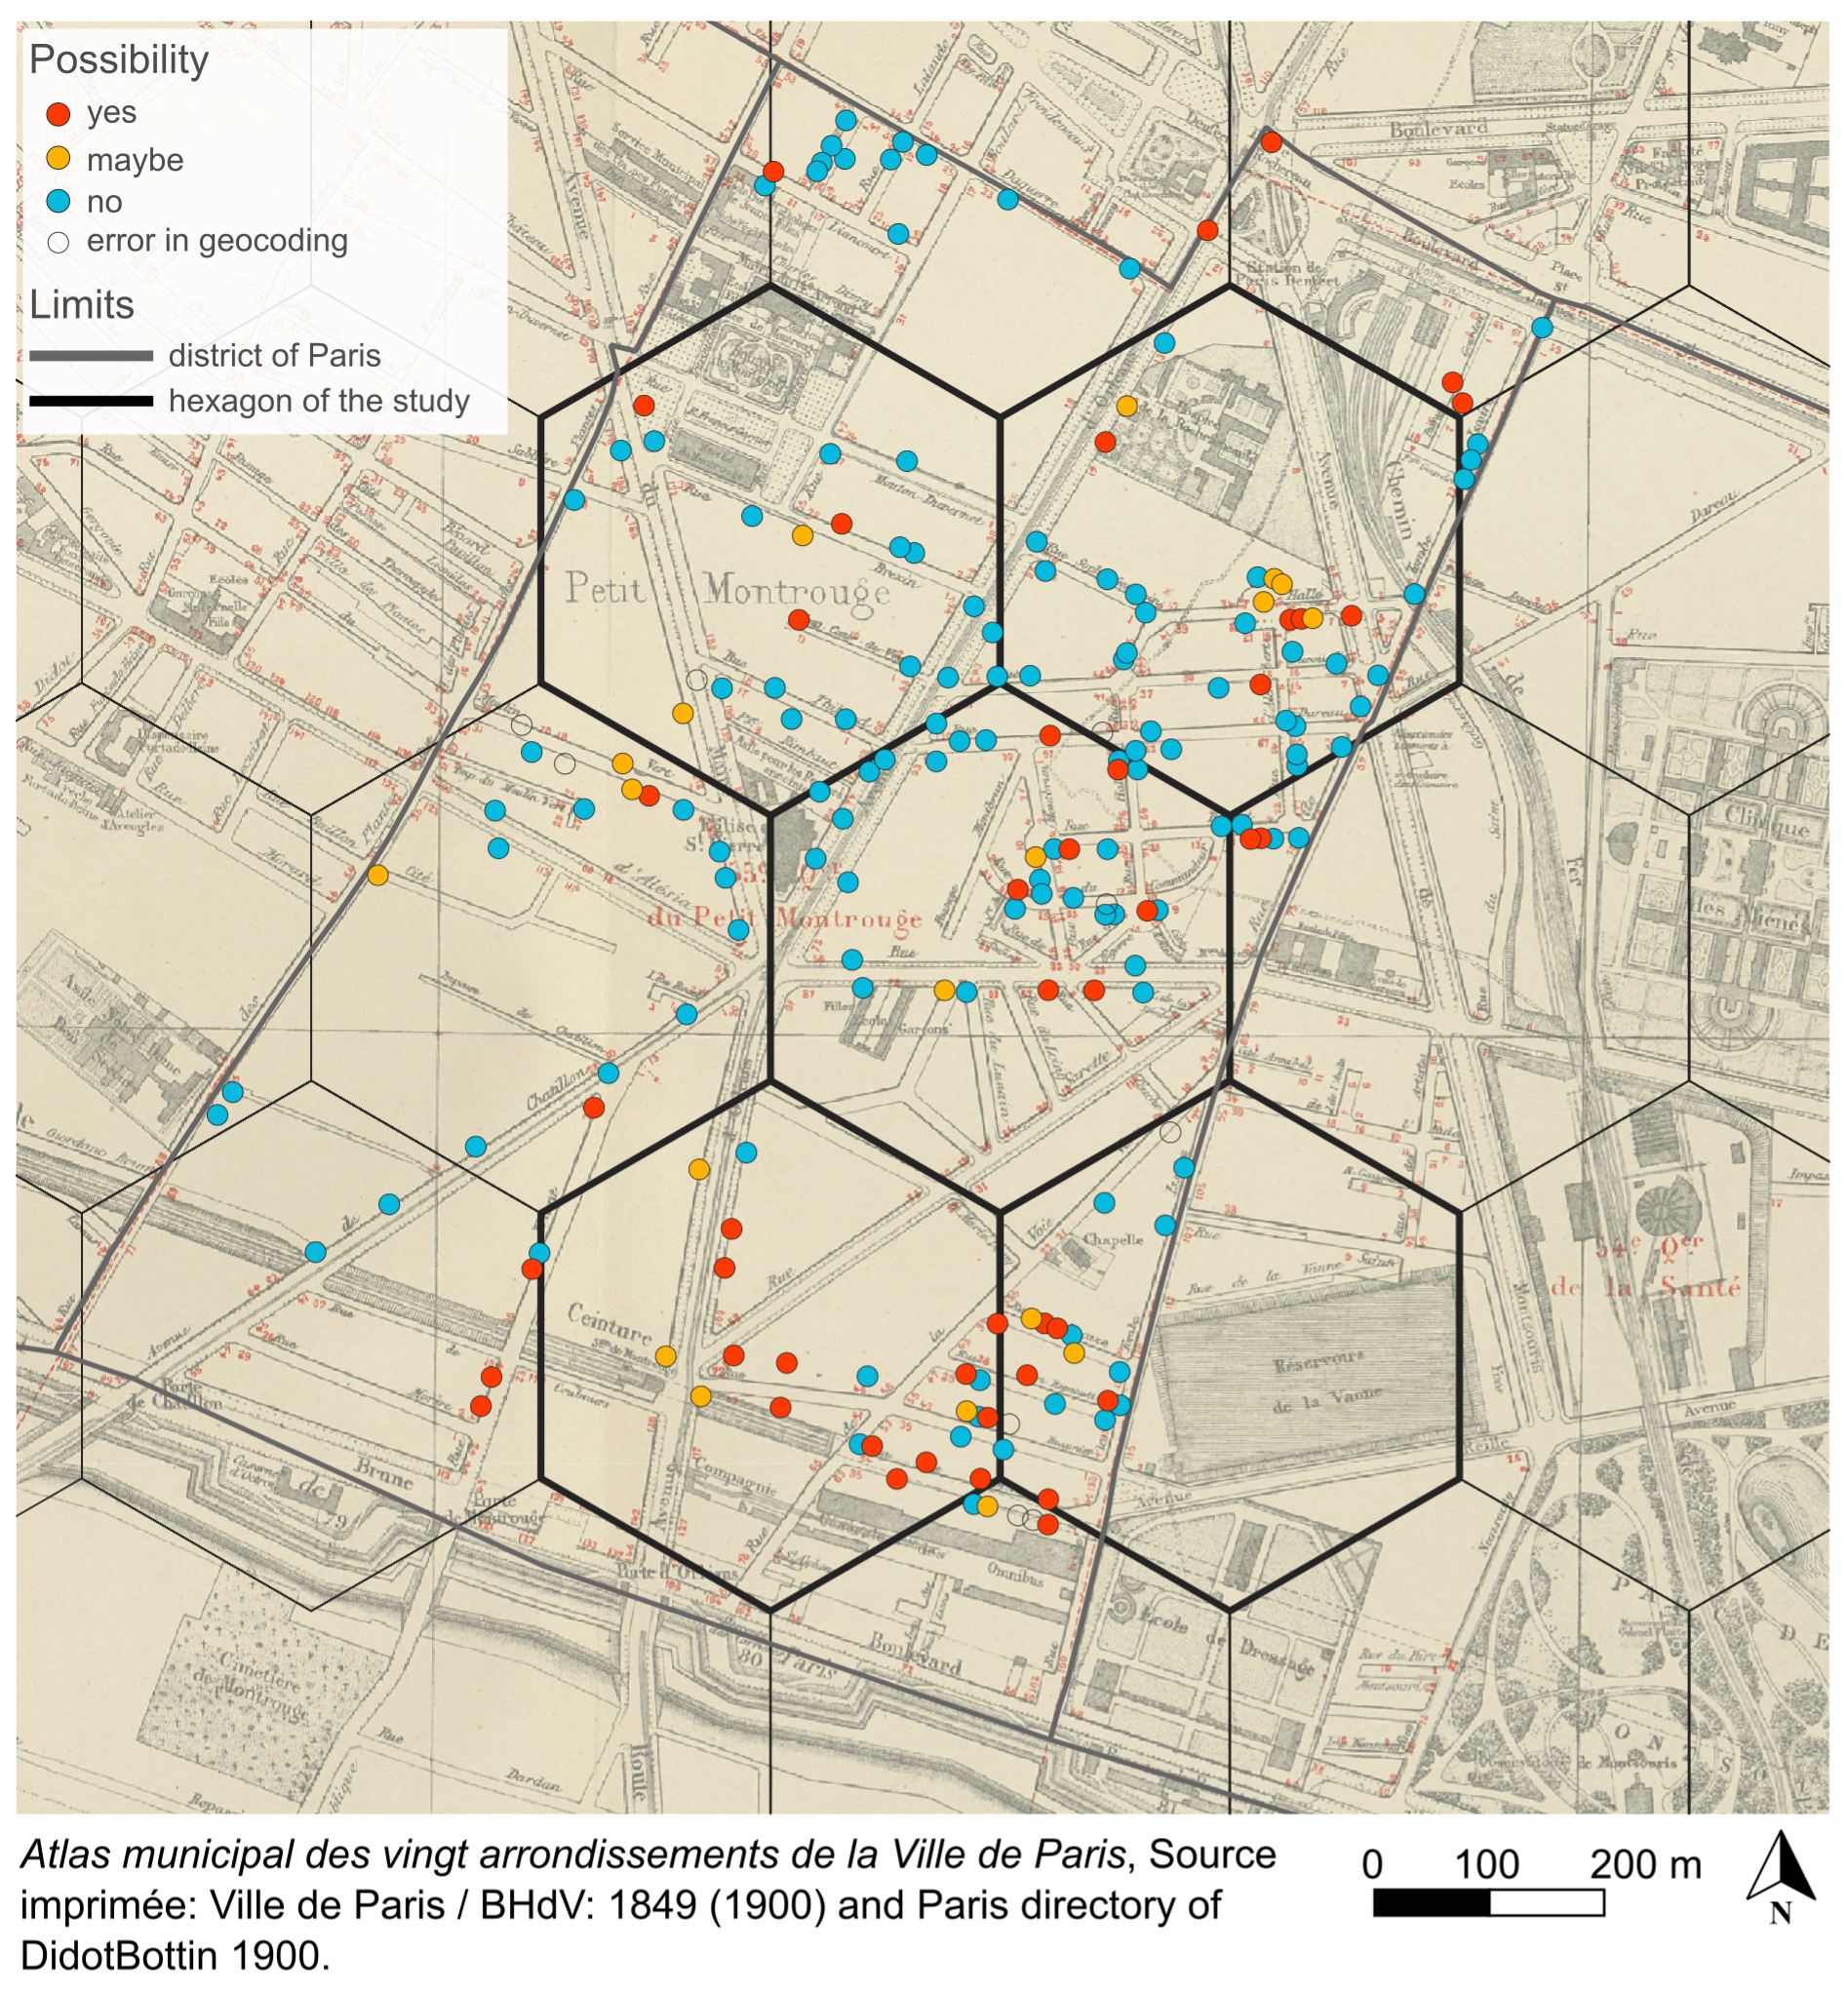
The presence of individuals located outside the Fermiers
généraux wall before 1860 reveals the editors’ conception of Paris.
Figure 3 represents geolocated addresses in western Paris in 1855 and 1860. The
space of the directories covers part of the urbanization front, outside the area
delimited by the Fermiers généraux wall (red dots
in 1855 on Figure 3). In this sense, editors did not conceive Paris in terms of
its administrative and fiscal boundaries, but in terms of its socio-economic
functioning. The important issue was to connect individuals in the city and from
the city with others who were part of wider networks by establishing lists, and
including, if necessary, individuals who lived or performed their activities
outside the Fermiers généraux limits but belonged to
socio-economic networks of Paris.
4. Methodology: density analysis of geolocated addresses points
4.1. Distinct geolocated directory addresses points
A single directory entry may contain several addresses, and the same address may
be found in many directory entries. For instance, when an entry contains a
separate manufacturing and sales location or, conversely, when the same
manufacturing location houses several manufacturers. As a result, the geocoding
process of entries locates all occurrences of the same address at the same
coordinates, resulting in many duplicated address points (see Appendix 8.3.1 for
an extended example).
Since the study focuses on the evolution of the urban fabric using directories,
rather than the distribution of individuals in the city, we consider only unique
occurrences of geocoded addresses within each directory. To achieve this, we group
overlapping geocoded address points into a single point, retaining only distinct
addresses from each directory. These “distinct geolocated directory addresses
points” are referred as “geolocated addresses” in the following text
and figures for the sake of simplicity.
4.2. Point density analysis
Our study relies on Miller and Goodchild’s (2015) conception of data-driven
geography. The large volume of spatial and
“messy”
[
Miller and Goodchild 2015, p. 2] socio-spatial data produced in the SoDUCo
project provides an opportunity for a heuristic knowledge discovery approach:
Starting from the hypothesis that geolocated addresses may correlate with the
urban sprawl and densification of Paris, we explore the various aspects of the
data that may bear witness to this dynamic.
We prioritize geovisualizations to facilitate data exploration and understanding.
Our focus is on the evolution of the density of geolocated addresses over time and
at the city scale, deliberately setting aside the analysis of point patterns. We
chose not to delve on spatial patterns in the local configurations of all
geolocated address points as they are deeply tied to urban structures such as the
street network, which has already been extensively analyzed for Paris during the
19th century [
Barthelemy et al. 2013].
Additionally, we opt for a discrete representation of densities rather than
estimating continuous spatial distributions, e.g. through kernel smoothing. First,
the results of these techniques may be less well understood from an interpretative
point of view. Indeed, regular tessellation
“suggest the use
of an estimation process [...] in contrast, smooth contour lines give little
clue to this underlying estimation step”
[
Carr, Olsen, and White 1992, p. 231]. Secondly, as noted by [
Evangelista and Beskow 2018], social spatio-temporal phenomena are typically
discrete information; in our case, they exist only where addresses are present.
Spatial smoothing techniques are likely to spread information in areas where there
are no buildings and addresses, generating cartographic artifacts which impair
visual understanding of the phenomenon. The edges of the city, which are a focal
point of our study, would be significantly affected as data points are scarce in
those areas.
In order to have a stable framework for studying the evolution of geolocated
addresses, we create a hexagonal grid covering the maximal extent of Paris over
the 19th century, then bin geolocated addresses points in cells at each time step
to produce a series of 2D histograms whose cells are immediately comparable [
Carr, Olsen, and White 1992]. The advantage of a hexagonal grid over a more commonly
used square grid is that the nearest neighbors in a hexagonal grid are
symmetrical. Indeed, the barycenters of neighboring hexagons are equidistant,
unlike those of a square grid, where diagonal neighbors have greater distances
than neighbors of the four cardinal directions. As Peuquet noted,
“radial symmetry makes this model advantageous for radial search
and retrieval functions,”
[
Peuquet 1984, p. 85] making it especially useful for
analyzing intra-urban density, given the center-periphery structure of this
spatial phenomenon.
The drawbacks of this method are the same as those of the quadrats
[4]: It is
not sensitive to the relative position of the addresses within the cells, and the
densities created are sensitive to the resolution of the grid. The first
limitation is irrelevant in our case as we are not interested in exploring point
patterns. However, the second limitation is important because the aggregation of a
points pattern into area-based surfaces is always sensitive to the size of the
spatial entities [
Openshaw 1983]. The larger they are, the weaker
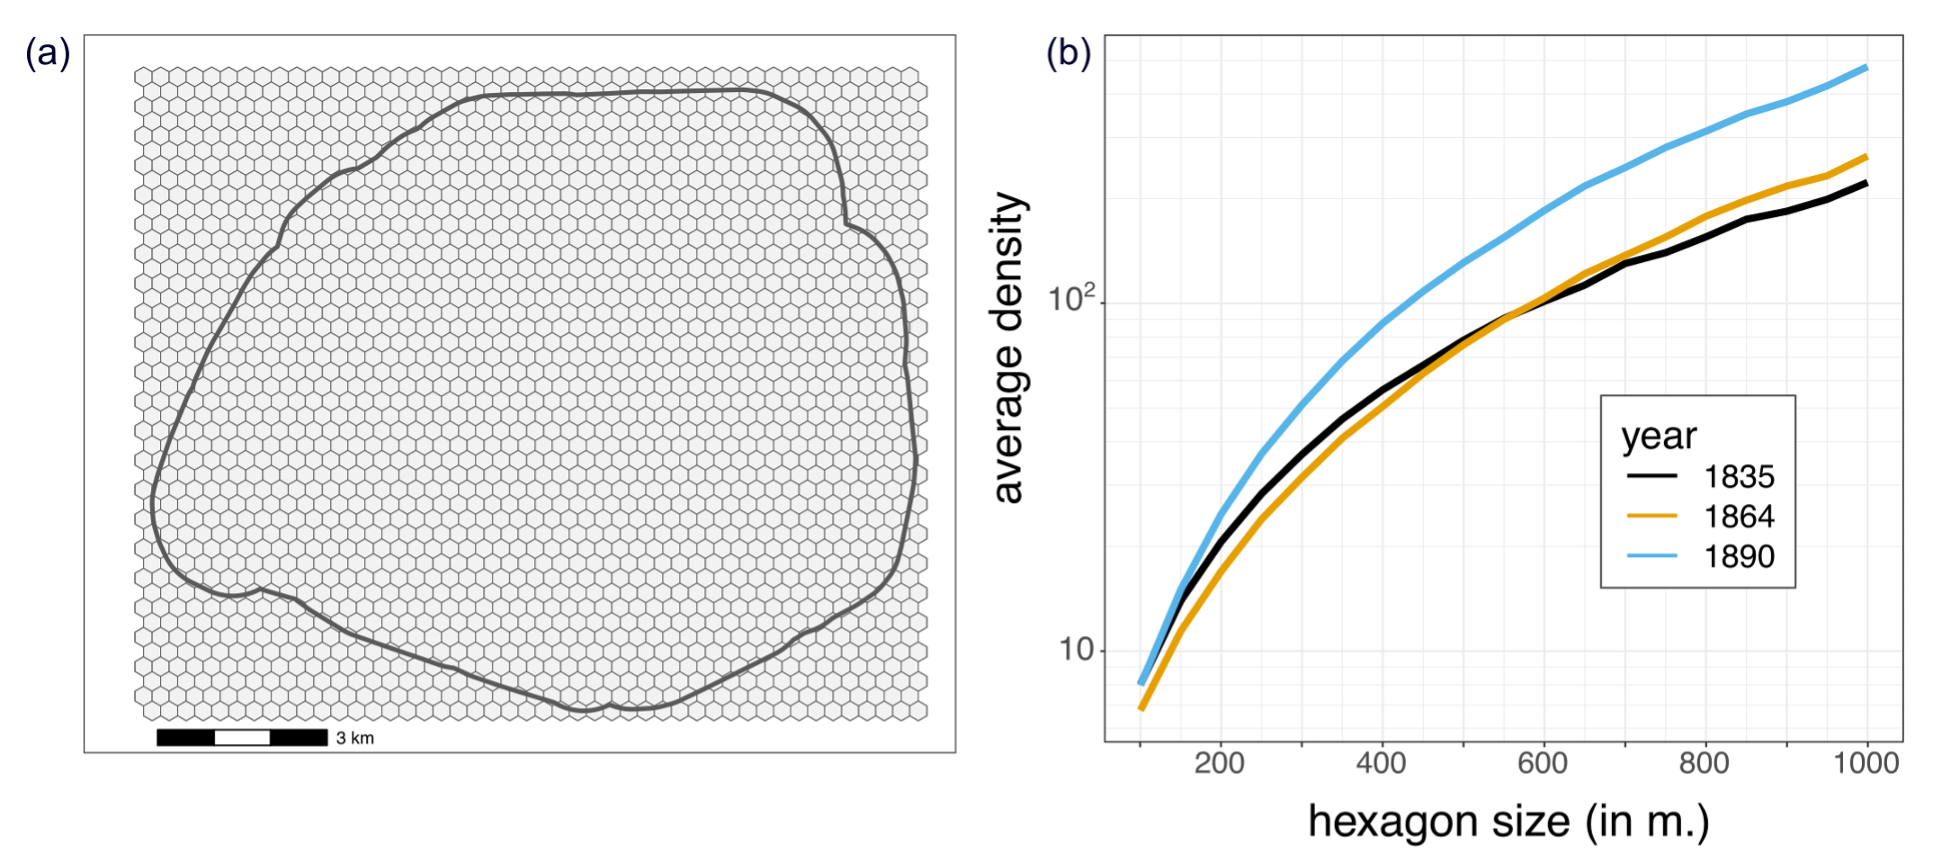
the spatial differentiation/concentration. In order to choose an appropriate grid
resolution, we proceeded iteratively by testing several cell sizes from 100 to
1,000 m (Figure 4, a). The average density of geolocated addresses across
different hexagon sizes at three different dates reveals continuous growth (Figure
4, b). Consequently, there is no particular hexagon size that should be
prioritized to measure urban density. Instead, the selection of one hexagon size
over another must be made qualitatively. After several iterations of size
parameter explorations, we settled on a threshold of 400 m, which appears to be a
good compromise. On the one hand, the grid remains quite fine, as a 400 m hexagon
represents a very small central district of Paris. On the other hand, it is wide
enough to ensure cartographic legibility.
5. Urban sprawl and density of Paris (1822-1914)
The data obtained from the digital transcription and enrichment of directories
changes the analytical framework: 1) in terms of precision, with very fine spatial
(address-level) and temporal (quasi-annual) resolutions; 2) in terms of scope, as
the
entire spatial and temporal evolution of the city can be apprehended over a century.
In this section, we show how these changes enable us to build up a global panorama
of
socio-spatial dynamics of Paris. We examine the urban space drawn by the directories
and the gazetteer used in the geocoder (5.1). We then present a synthetic overview
of
the urban sprawl and de-densification of central Paris between 1822 and 1914 (5.2).
Finally, we show how the data-driven approach reveals differentiated urban dynamics
(in space and time), providing the basis for new hypotheses and further research
(5.3).
5.1. The “numbered” space of Paris: The urban fabric transcribed through
directories and through the gazetteer
We approximate the “numbered” space of Paris through the concave hulls
calculated from the address points of two atlases of the gazetteer. The resulting
areas are shown to scale in black in Figure 5, together with the administrative
boundaries of the city (in white) and the total mapped area (in gray). Both
atlases are working and communication tools of the Municipality, showing the
surroundings of the city for illustration purposes, and do not indicate any
numbers in these zones. Within the city, the space covered by numbers does not
cover the whole administrative area. The difference is noticeable between 1836 and
1888. At that date, only the outskirts of the fortifications are unnumbered, while
address points are rare in a wide band around the 1836 boundaries. These areas are
shown as built-up on the maps, but they are made up of large urban blocks that are
often devoid of information, suggesting that urbanization is still very partial,
or at least poorly recorded by the urban administration.
Comparing address points extracted from the atlases with geolocated addresses of
directories allows cross-analysis of the areas covered by these two kinds of
sources. We focus on (1) the subsets of distinct addresses in the gazetteer for
the two atlases
[5], and (2) the distinct
geolocated addresses in the 1835 and 1890 directories. The sets of points in the
gazetteer and the directories can be compared by looking at their relative spatial
distribution (Figure 6). Each sub-figure (a, b, c, d) plots the ratio \( ρ_g/ρ_d\)
of the density of
geolocated addresses in a directory \(d\) (top line: the 1835 directory, bottom 1890)
with those in one
of the atlases \(g\) of Paris
(left: the Jacoubet 1836 atlas, right: the Municipal 1888 atlas). Values less than
1 indicate that the directory contains more geolocated addresses than the
gazetteer. This is possible because the geocoder prioritizes sources close to the
query date but can also retrieve results from a more temporally distant
cartographic source (see Appendix 8.1). For example, if an address from the 1835
directory is not found in the Jacoubet source, it may be geocoded using data from
the 1888 Municipal atlas. To help the reader, the main figures are accompanied by
the density maps of the geolocated addresses of the directory and the atlas
compared.
Views (a) and (d) in Figure 6 show that the ratio between each directory and its
closest atlas in time is close to 1. In addition, over 98.5 % of the distinct
addresses in the 1835 and 1890 directories are geolocated (see Appendix 8.3.2).
The directories therefore are fairly representative of the density of the numbered
buildings, with less accuracy for the recently urbanized edges.
A subset of addresses from the 1835 directory have been geocoded using the 1888
atlas, as shown in (b). However, there are very few of these directory addresses
compared with those of the atlas in 1888 (see density maps to the right in (b)).
Conversely in (c), the 1890 directory shows that the margins of Paris before 1860
are now largely present in the directory and are anchored in an area that is
probably much denser than in 1836 (green hexagons). The opposite dynamic can be
seen in the extreme center of the city. Indeed, there are fewer geolocated
addresses in the 1890 directory than in the Jacoubet atlas (c), and more addresses
in the 1835 directory than in the Municipal atlas (b).
5.2. Urban sprawl and city center de-densification (1822-1914)
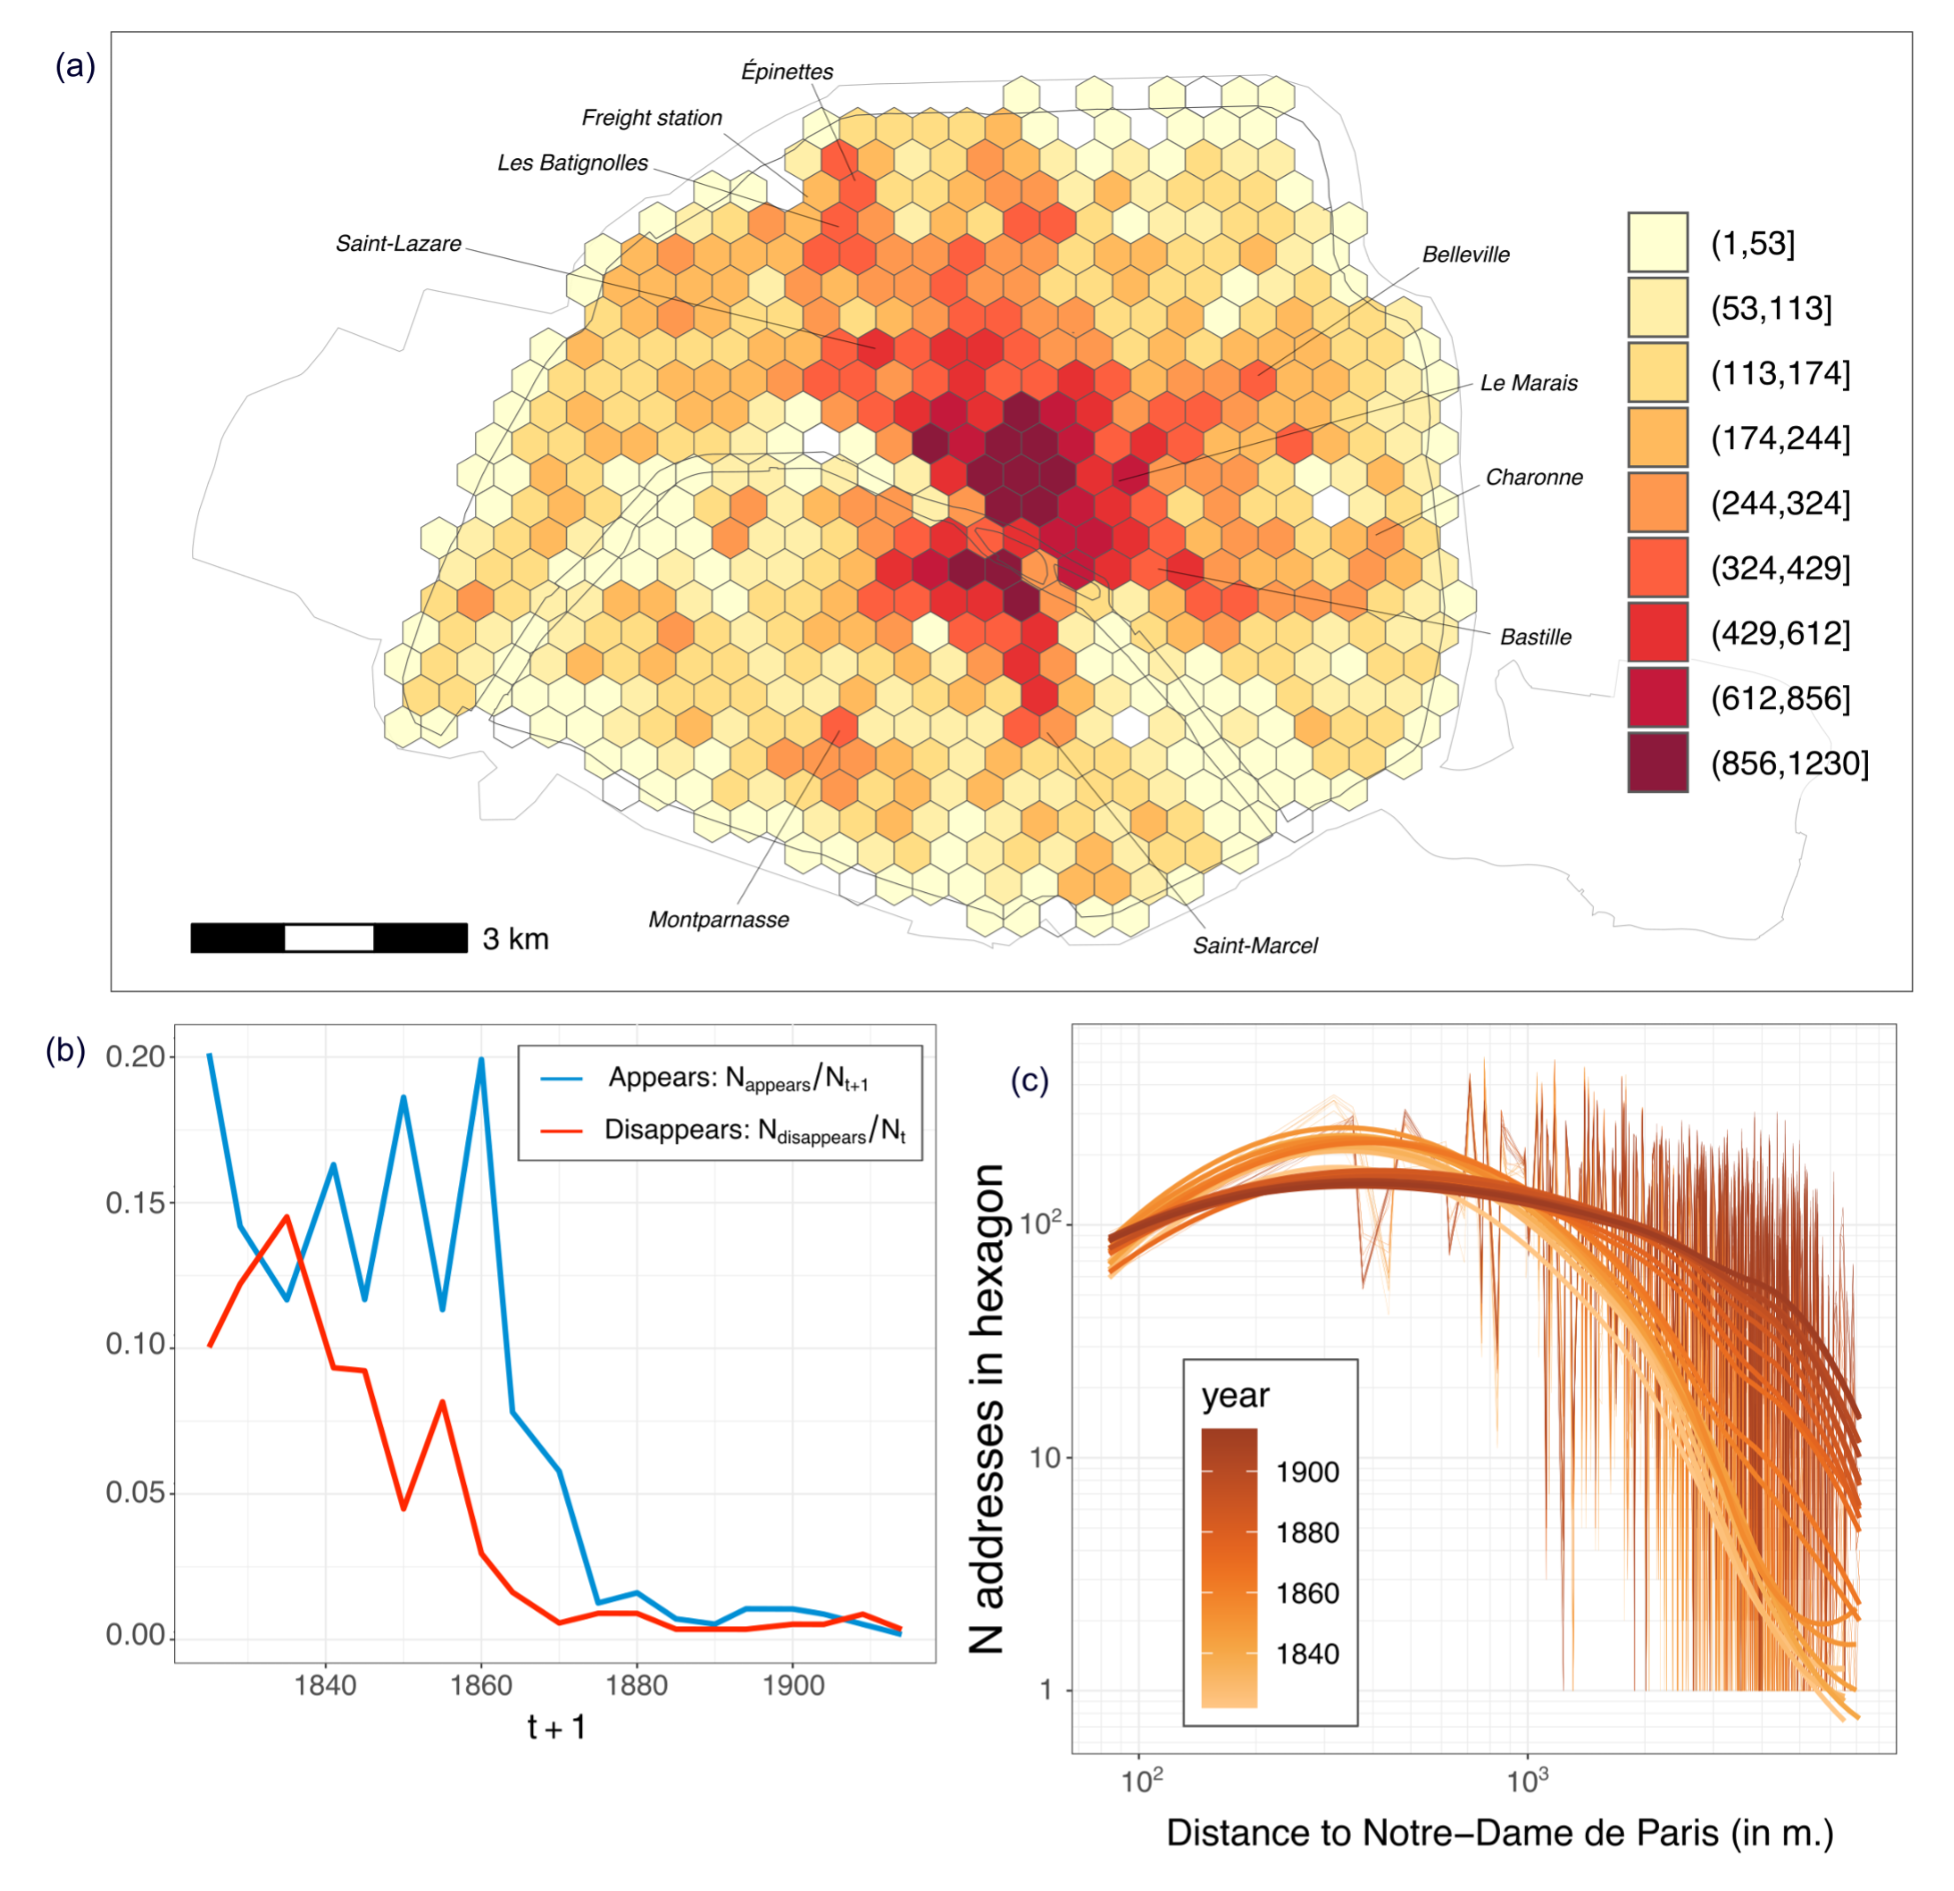
Figure 7 (a) reveals a panorama of the density of Paris through the cartography of
all geolocated addresses. The space is particularly dense in the vicinity of La
Cité and Saint-Louis Islands. On the right bank of the Seine (to the north), the
very high density is mainly included within the former boundary of the enclosure
of Charles V. On the left bank of the Seine (to the south), the densest areas are
those formerly included in the wall of Philippe Auguste, particularly in the Odéon
neighborhood and the Latin Quarter.
The center-periphery gradient of urban density is also clearly visible from La
Cité. On the left bank, the gradient runs southeast along Mouffetard street to the
Saint-Marcel faubourg. From the Odéon neighborhood, the gradient is noticeable to
the west, along Saint-Germain boulevard. On the right bank, the center-periphery
gradient is sharper to the east of the dense zone than to the north and west. From
the dense center, the gradient runs eastwards from the Saint-Paul neighborhood
through Bastille to Saint-Antoine, along Faubourg Saint-Antoine street, and then
northwards to Charonne. A gradient is also noticeable from the Marais to
Belleville. In the years 1820–1850, these central-eastern areas were the most
densely concentrated in terms of workshops and factories. Although the
industrialization of Paris led to the establishment of large industrial
establishments from the 1850s onward all around the
Fermiers généraux walls (much less in the west), the collective
manufactures remained concentrated in the center-east until the end of the century
[
Larroque and Jigaudon 1980]
[
Cottereau 1997]
[
Gribaudi 2014].
Lastly, we identify areas of density located in the vicinity of railway stations:
towards the Montparnasse station (south), in the vicinity of Saint-Lazare
(center-west), and in Batignolles and Épinettes neighborhoods (north-west), near
the Chemins de Fer de l’Ouest freight station.
The sub-figures (b) and (c) in Figure 7 illustrate the overall dynamics of
geolocated addresses. Sub-figure (b) shows the frequency of hexagons appearance
and disappearance. A hexagon appears when it contains geolocated addresses at time
\(t+1\) while being empty at
time \(t\) (and vice-versa for a
disappearance). New areas covered by directories were quite numerous until 1860,
with hexagon appearances representing between 12 and 20% of them (shown in (b)).
However, the variation from one date to the next reveals some noise during the
geocoding in areas outside the municipal boundary before 1860 (see discussion in
Section 6.1). Thereafter, appearances become less numerous, although new areas
continue to be occupied up to the mid-1870s. Meanwhile, less dense and more
peripheral areas also undergo erasure movements until the early 1840s, with
between 10 and 15% of hexagons disappearing
[6]. This trend persisted until 1870, albeit with a significant
reduction.
The center-periphery gradient persists throughout the study period (see Figure 7,
(c)), but it gradually diminishes over time. For instance, until 1855, the density
ranges from around 200 to 300 geolocated addresses per hexagon within
approximately 1 km of Notre-Dame cathedral, sharply declining beyond 2 km to
approximately 1 to 50 geolocated addresses per hexagon. Similar patterns are
observed until 1864, with slightly denser hexagons beyond 2 km from Notre-Dame.
Then, from 1870 to 1914, central areas experienced a slight decrease in density,
with hexagons within 1 km of Notre-Dame consisting of approximately 200 geolocated
addresses, while peripheral areas beyond 2 km became much denser. However, density
variations between hexagons remain significant, as evidenced by the notable
fluctuations of the thin lines in (c).
5.3. A century of the dynamics of urban density
We explore the overall picture in greater depth over time and space, in order to
identify the dynamics of urban density more precisely. To this end, we plot the
slope of the number of geolocated addresses per hexagon, normalized in space by
period in Figure 8. This representation provides two main spatial and temporal
reading levels. The first level refers to the whole city for a given period, and
the second to a specific segment of the city over several periods. In the
following subsections, we develop these two reading levels through case
studies.
5.3.1. The high society neighborhoods of Paris in the early 20th century
revealed through a source effect
Given that hexagons are growing on average for each period, negative values
generally represent lower relative growths than hexagons with positive values
in Figure 8. As an example in the initial period (1822–1825), there is a trend
of greater relative growth of geolocated addresses in the city center compared
to the periphery, indicating a notable center-periphery gradient.
Some periods may be marked by general decline. This is particularly true of the
years 1900–1904, where the average slope is -0.222. The positive values of the
hexagons thus reflect a lower relative decline than those of the negative
values (in strong decline). The decline in the number of geolocated
addresses
[7]
is fairly widespread throughout Paris, although some areas are still
growing
[8]: south-west, north around
Montmartre and the Nord and Est railway stations, and east in the 12th and 20th
arrondissements.
The general decline in 1900–1904 reflects editorial choices made by the company
that published directories during this period. Indeed, starting from 1903, the
editors of the Didot-Bottin initiated the creation of a separate directory
dedicated to prominent individuals, titled the
Bottin mondain
[
Firmin-Didot and Firmin-Didot 1903]. This new edition led to the exclusion of
individuals from the Didot-Bottin general directory studied here. The excluded
entries are varied, notably individuals designated as owners or annuitants, but
also deputies, ministers, or advisors at the Court of Cassation. Other
categories such as bankers, placement agents, and doctors remained in the
general directory. Thus, these people were not considered to belong to this
social echelon by the editors of the time, and/or they were deemed
indispensable to the list of actors in the socio-economic life of Paris,
appearing in both lists (the specific
Bottin
mondain list and the general list).
The socio-spatial divide of Paris from west to east is well-known during the
20th century, notably thanks to historical studies of the
Bottin mondain conducted by Cyril Grange [
Grange 1993]. However, the gradient of the social division of
Parisian space at the turn of the 20th century is clearly identifiable on the
1900-1904 map in Figure 8. The gradient is not entirely linear. It includes a
hyper-concentration (dark green hexagons on map) of prominent inhabitants in
the 8th arrondissement (south of Parc Monceau) and the 16th arrondissement
(Chaillot neighborhood). On the other hand, a continuum of affluent
neighborhoods is apparent in the city’s center-north (9th arrondissement),
center-southwest (in the 7th arrondissement between Saint-Germain and the
Invalides), and in the center near the Saint-Louis Island. Other areas are also
noteworthy, in particular the Petit Montrouge district in the south of Paris in
the 14th arrondissement. Indeed, the south of the district is wealthy (see
Appendix 8.4), whereas the concentration of affluent families is almost
invisible on the scale of the districts of Paris studied by [
Grange 1993]. This is likely due to the fact that his study is
based on a sample of 4,500 addresses from the
Bottin
mondain between 1903 and 1987, i.e. a sampled view of one social group
(that of the
Bottin mondain),
whereas the present study is based on all the addresses of the directories,
i.e. an exhaustive view of a set of social groups (of the directories).
5.3.2. Dynamics of densification of the 16th arrondissement and the southern
17th arrondissement
Figure 8 lets us analyze the density trajectory of a city segment over time.
The data-driven approach offers two main advantages: 1) We do not predetermine
the study area a priori, e.g. by selecting districts or arrondissements; 2) the
dynamics of the area under study are examined in relation to the urban space as
a whole.
In the 1850s and 1860s, the west of Paris underwent significant street
development, leading to the emergence of new neighborhoods and increased urban
density in these areas. Indeed, while only 9.3% of Haussmann’s construction
expenditure was associated with the newly annexed area beyond the
Fermiers généraux, most of the work was carried out in
western Paris, with the development of the Place de l’Étoile and the
Champs-Élysées, for example [
Faure 2004]. Street development is
well-documented in cartographic sources [
Andriveau-Goujon 1868]
and particularly significant in the 16th arrondissement and the south of the
17th arrondissement, south of the railroad lines leading to the freight station
near Batignolles and the Saint-Lazare station (see Figure 3). However, the rate
and extent of the densification of this area are unknown.
This area has been entirely covered by hexagons since the mid-1850s (in
particular beyond the Fermiers généraux wall,
see Figure 8). Geolocated addresses show overall positive slopes from that
point until 1900, but the normalized slopes per period shown in Figure 8 only
exhibit consistently positive trends from the mid-1880s in the 16th
arrondissement (with the exception of the years 1864–1870). On the other hand,
they show positive trends from the mid-1850s onward for the southern part of
the 17th arrondissement (except for the period 1880–1885). Consequently,
compared to other parts of Paris that experienced densification during the
second half of the 19th century, the intensity of densification in the southern
part of the 17th arrondissement was significant enough by 1855–1860 to be
notable on a citywide scale. However, it was not until another three decades
later that densification in the 16th arrondissement became apparent, coinciding
with a period of deceleration in densification across the city.
Several factors contribute to understanding this difference in the pace of
densification in Paris. Firstly, large industrial establishments were set up
mainly in the north and east of Paris between 1850 and 1870. This partly
accompanied the urban growth and densification shown in Figure 8. Subsequently,
Haussmann’s work in central Paris involved the construction of new streets and
the reorganization of city blocks to accommodate new buildings. To achieve
this, the administration’s authority to expropriate property was extended in
1852. Between the end of that year and 1859, 2,236 houses were demolished by
expropriation in Paris, according to Haussmann himself. As a result, over time,
some of the city’s inhabitants migrated to more peripheral areas — notably to
the east — all the more so as rents of older constructions raised dramatically
in the 1850s (by over 50%). Lastly, the newly built-up areas of the north of
the 16th and south of 17th arrondissements are characterized by wide avenues
and a high concentration of Haussman-style buildings, which have a low built
density compared to other Parisian areas [
Larroque and Jigaudon 1980]
[
Faure 2004].
In addition, qualitative analysis of the geocoding quality of directory entries
in the years 1855–1860 reinforces the identification of the local trajectories
of the south of the 17th arrondissement. Figure 3 shows geocoding problems in
the western edge of the city. In 1855, some entries were incorrectly geocoded,
as in Jouffroy street, south of the railroad lines. All the addresses in the
directory refer to the “Passage Jouffroy,” opened in
1845 and located in Montmartre. The densification dynamic between 1845 and 1850
observed by the two pink hexagons in Figure 8 is thus a geocoding bias. On the
other hand, the problem of distinguishing between the Jouffroy passageway and
street during geocoding is the same for the years 1855 and 1860. Consequently,
the calculation of space-normalized slope for this period — and subsequent
periods — is not altered by this geocoding bias, and the growth of the southern
17th arrondissement since 1855–1860 is historically dynamic.
6. Discussion
First, a qualitative assessment of the geocoding results for the 1845 directory
enables us to elaborate on the challenge of accurately apprehending urban margins
prior to the 1860 extension of Paris (6.1). We then examine the increasingly pressing
issue of how data produced by third parties can be appropriated and properly reused
in historical sciences, especially with the recent surge in open digital data from
archival sources. This challenge is particularly significant when large volumes of
digital data are generated through automated extraction and enrichment processes.
We
discuss two main questions: How and under what conditions can such digital sources
be
used effectively? (6.2) How can we understand them, assess their quality and their
relationship with the original sources? (6.3)
6.1. The difficulties of precisely capturing the edges of the city before
1860
Examining the geocoding outcome and metadata of a specific directory enables a
qualitative and critical assessment of the process. We concentrate the evaluation
on the 1845 Didot directory because it was edited after the completion of the
Thiers wall, which created a new singular interface between the old and new
enclosure [
Firmin-Didot and Firmin-Didot 1845].
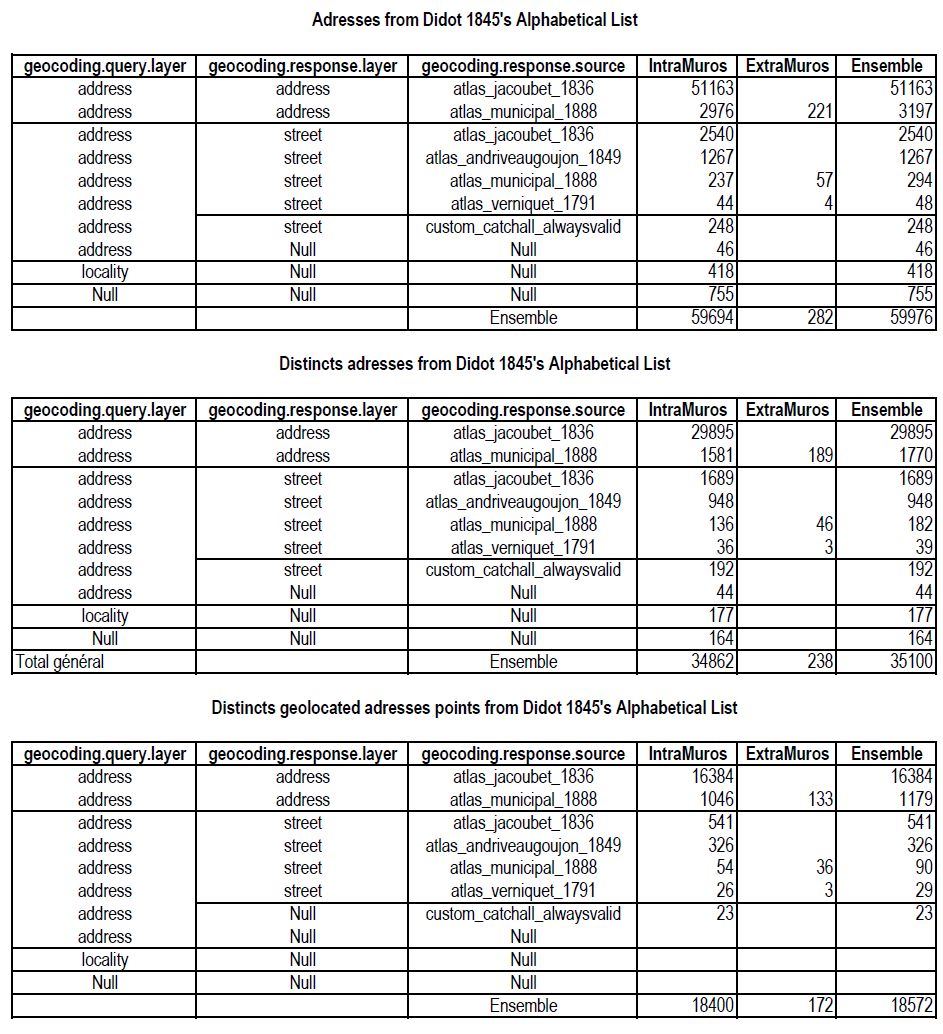
The table in Appendix 8.3.3 presents geocoding statistics for the 1845 directory,
organized according to the granularity level at which a match was found in the
gazetteer (at street or address-point). 94.6% of the geolocated addresses of the
directory are address-point. Looking at the contribution of the gazetteer’s
sources of the geocoder, 88.2% of them match with the 1836 Jacoubet atlas. These
high proportions of matching from the 1845 directory and 1836 gazetteer reveal
that the majority of addresses are located within the administrative limits of
Paris. The residual set of extra-muros geolocated addresses is very low: Only 172
are located outside of the Fermiers généraux wall
(0.009%).
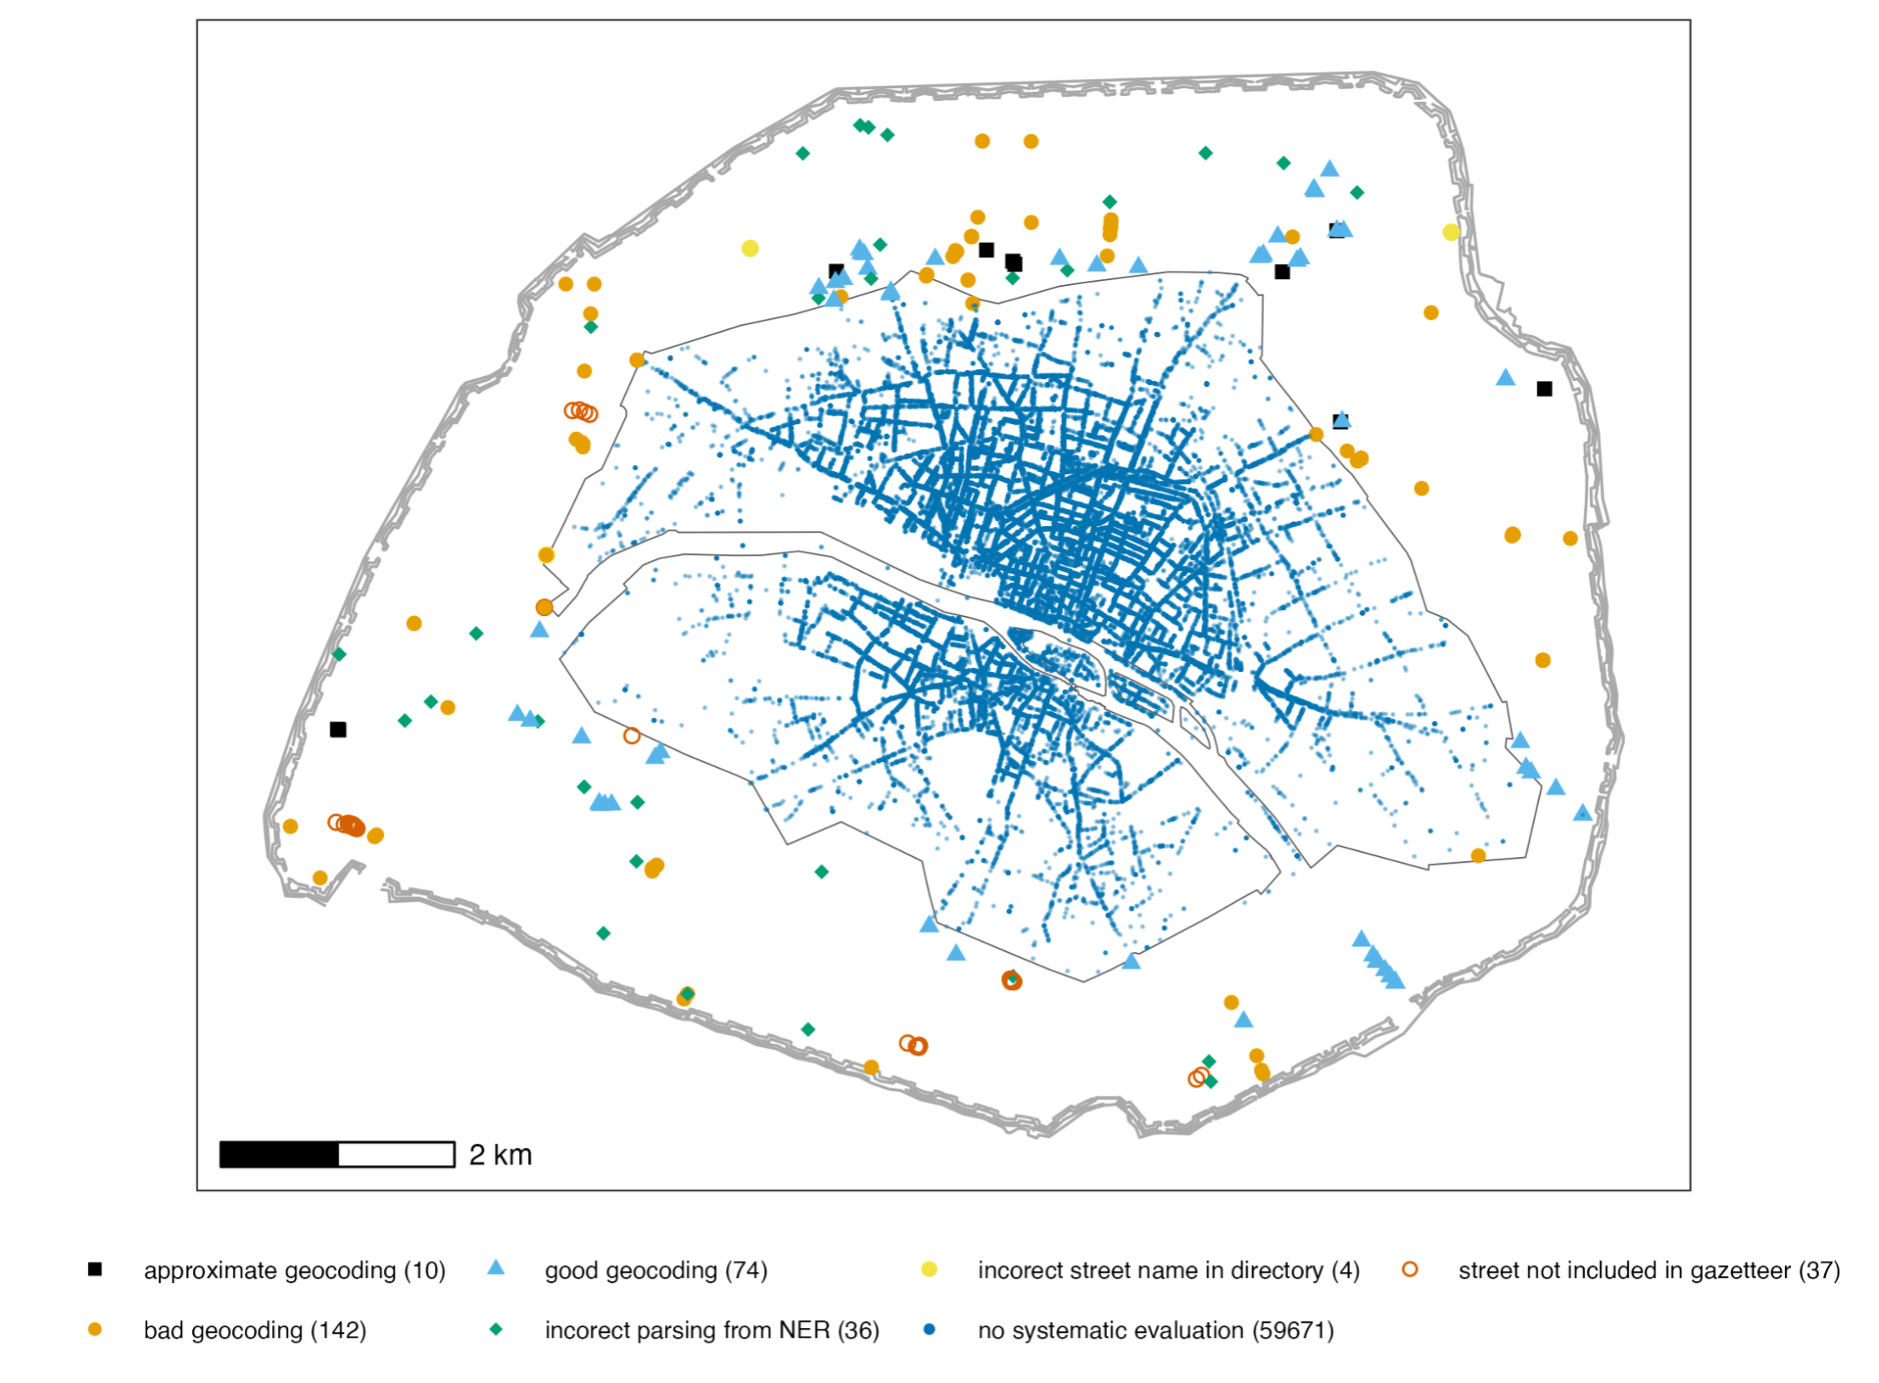
A detailed study of these specific geolocations reveals that only 40% are correct
(see the map in Appendix 8.3.3). They are mainly concentrated in the business
neighborhoods of Bercy and near Ivry station, as well as in a few places around
Grenelle-Vaugirard and Vincennes. In the north, they are concentrated in a few
streets in the neighboring municipalities of La Villette, Montmartre and
Batignolles-Monceaux. However, these last two municipalities have expanded since
the 1820s [
Frondizi 2018]. These front lines of extramural
activities are confirmed by the systematic manual examination of the 123 addresses
in the alphabetical list and interpreted by the geocoder as
“localities” (see
the table in Appendix 8.3.3).
To sum up, the alphabetical list of 1845 partially records activities in the inner
suburbs. A focus on these peculiar spaces would require leveraging complementary
sources, in particular the Départements section
of the Didot directory, which includes a short list of the main shopkeepers in
each municipality. It is a possible perspective because the SoDUCo pipeline chain
can be applied to new and similar sources.
The case of the 1845 directory highlights the need for a critical analysis of the
edges of Paris up to the 1860s–1870s. In other words, the identification of
spatial patterns, as in the case of the 17th arrondissement study (see Section
5.3.2), requires to be confirmed by an in-depth qualitative analysis of the
geolocated addresses at the level of each directory entry, in order to discuss
what belongs to geocoding bias or to historical spatial dynamics.
6.2. Conditions for re-appropriating digital and enriched data of Paris
directories
Four main choices had been made in the SoDUCo project to encourage the
re-appropriation of Paris directories data.
The first is to consider very general named entity classes during the data
enrichment processes, specifically during the Named Entity Recognition (NER)
stage, in the content of a directory entry. Residents, shops, businesses and
institutions are all labeled as
“persons,” descriptions of their professional
or commercial activities fall into a single class named
“activity,” and their
addresses are made up of
“location” (i.e. street name) and
“cardinal”
(street number) entities [
Abadie et al. 2022]. The classes of recognized
entities are deliberately very broad in order to facilitate querying and
recombination of information. The objective is not to reconstruct — and therefore
impose — categorizations
[9] that
would be considered useful a priori, by grouping institutions on one side and
physical individuals on the other, for example, while the boundary is absolutely
non-obvious historically and in the original sources. Moreover, enriching
directory entries by geolocation is useful for different uses of the sources, and
physical space is a shared and semantically neutral referential. However, the
geocoding process is not neutral either because it relies on specific cartographic
sources. We thus integrate all information relating to geocoding queries,
responses and internal geocoding quality metrics into the final data at the scale
of each address of the entries of directories.
The massive, fine-grained data created by an automated pipeline makes it possible
to construct a specific data corpus a posteriori. It is then easier to build
different, evolving sub-corpora as research questions evolve. In practice, two
choices in data enrichment are crucial: 1) to preserve the link with the initial
source at the level of each directory entry, notably by referring to the digitized
source at page level; 2) to contextualize directory entries, i.e. to link each
entry to the type of directory list (alphabetical, by profession, by street), to
the directory itself, its year of publication and its belonging to a
collection.
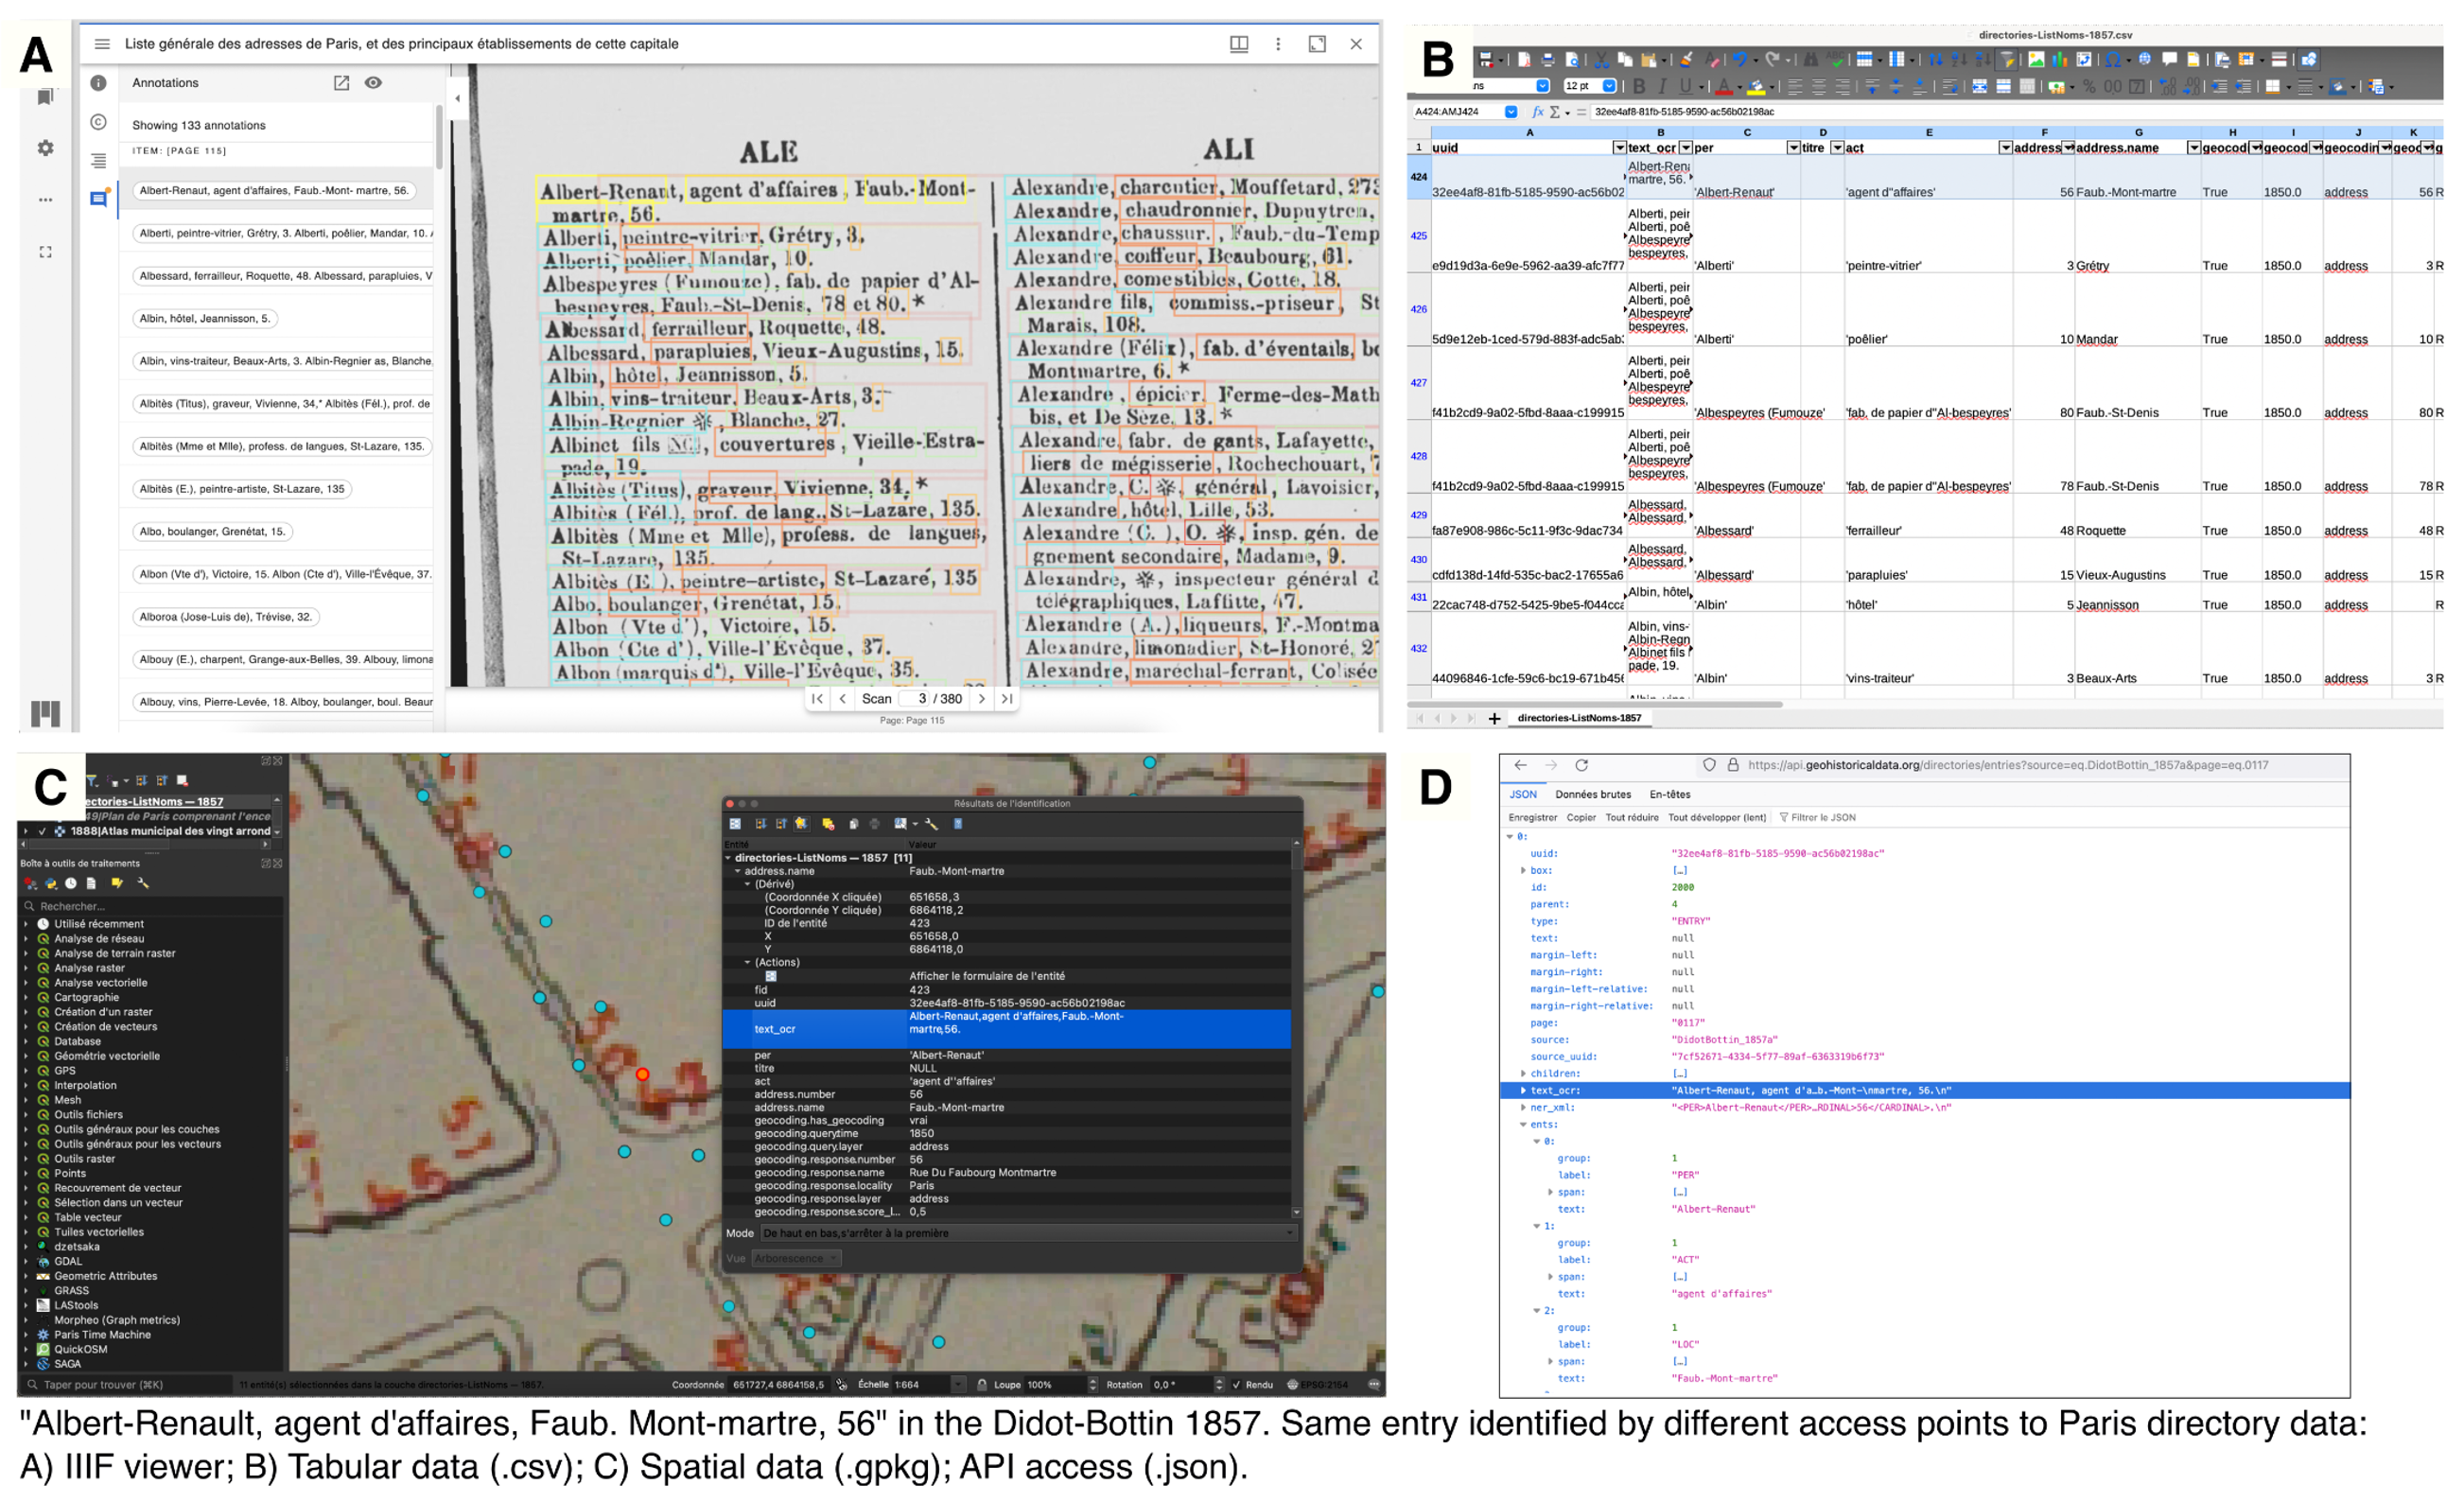
Re-appropriating data also involves developing differentiated and meaningful
accesses to data for different types of users. Indeed, the ways in which
information is sought from sources and how data is manipulated vary from one
audience to another. Four ways of accessing Paris directories data have thus been
developed (see Appendix 8.5). They also are complementary. For example, it is
useful to access the IIIF viewer at the same time as the datasets when studying
specific entries in a neighborhood.
Finally, the original corpus created during the SoDUCo project mobilizes
heterogeneous sources (maps and plans) from numerous heritage institutions and
archive centers. It is implemented in the form of a geocatalog [
Hersent et al. 2023], which makes it possible to bring together sources,
treatments and tools, intermediate results and various datasets produced
[10]. The choice is to keep track and opening the processing and intermediate
data used to build the accessible Parisian directories data
[11]. The directory extraction and data enrichment processing chains are bricks
on which others can rely to better understand the construction of the data
delivered, and from which other corpora can be created by reusing them.
6.3. A back-and-forth process between pipeline extraction, data analyses and
original sources
The critical historical assessment of the data follows a constant back-and-forth
process between the pipeline chain, data analysis, and the original source. The
methodology is therefore progressive, which is why we have chosen to produce
successive versions of the data in the SoDUCo project, with evaluation and
feedback to adjust the pipeline chain.
This critical assessment is based on manual evaluations and on global metrics on
the dataset. For example, the study of the statistical distribution of the number
of entries per page in the alphabetical lists of each of the directories, which
are theoretically constant because these lists and their entries are particularly
systematized in their form and length (see Figure 2) let us identifying that the
image segmentation process was problematic for the directories of the years
1802–1828. The pipeline chain was transformed to take account of this problem, and
the evaluation of the following version of the data using this metric shows a very
significant improvement
[12]. The metrics need to be intellectually created in interdisciplinary
collaboration between
“modellers” and
“thematicians”[13] — in this case here between
computer scientists on the one hand, and historians and geographers on the other —
to be meaningful in terms of data usage and thematic questions. The conditions for
interdisciplinary work need to be put in place, in particular with modellers who
are receptive to thematic issues and thematicians who are technically capable of
constructing metrics to assess the quality of these data.
The process of going back and forth finally makes it possible to qualify,
criticize, and understand the source of the directories. This is the case, for
example, in Section 3.2, where we show how the geolocation of entries ultimately
provides a better understanding of editors’ conception of Paris. Although the
directories of Paris have been used historically to study particular categories of
economic agents, such as art merchants [
de Maupeou and Saint-Raymond 2013], or ways of
socializing, as in the case of the study of the particular
Bottin mondain
[
Grange 1996], this source was still largely unknown before their
digital transcription and enrichment for the long period of 1787-1914.
Transforming material into data requires an effort to understand it, to qualify
its own biases, its internal logic and its relationship with the society that
produced it.
7. Conclusion
The data acquired through the digital transcription and enrichment of directories
enable the investigation of urban fabric at unprecedented scales. Following a
data-driven approach we shed light on the extent of urban sprawl and de-densification
of the city center, never before quantified over such a long period (1822-1914) and
with such spatial and temporal precision across the entire city of Paris.
Three main thematic findings stand out from our study.
The de-densification of Paris was studied on a city-wide scale based on historical
demographics — e.g. through analysis of de-populating dynamics [
Bonvalet and Tugault 1984] — or based on morphology, but on a micro-level such as
building blocks [
Gribaudi 2009]. We show that the de-densification of
the built-up hyper-center is notable on an urban scale from the 1870s onward, i.e.
twenty years after the start of the large-scale works led by Haussmann.
We identify the pace and relative magnitude of urban sprawl and densification on the
edges of Paris. We show that data-driven geography is a relevant framework for
studying the spatial trajectories of specific urban areas.
Finally, we show that massive data cannot substitute for source effects. But when
the
latter are correctly identified, they reveal new historical findings, as in the case
of affluent Parisian districts observed in the early 20th century and the non-linear
west-east gradient of Paris, which features concentrations of affluent individuals
in
small and specific neighborhoods, as we shown in the case of the Petit Montrouge
district in the 14th arrondissement. In this case, we demonstrated that results from
data-driven approaches enable defining new places of investigations, from a social
and spatial micro-history perspective [
Gribaudi 2014]
[
Frondizi 2018]. In other words, our methodology links the often
far-independent approaches of micro-history and large-scale studies.
8. Appendix
8.1. Integrating the evolution of cities and address systems in an automated
geocoding process
8.1.1. Parisian gazetteer from four maps and atlases (1784-1888)
Large-scale city maps are one of the most valuable detailed topographic sources
for building cartographic representations of past urban landscapes. Once
georeferenced, they act as a geographical proxy, locating entities such as
streets, buildings, and addresses on the surface of the Earth. In order to
leverage historical maps as a geocoding basis for the city directories, we
gathered a gazetteer of address points and streets created within previous
digitization initiatives.
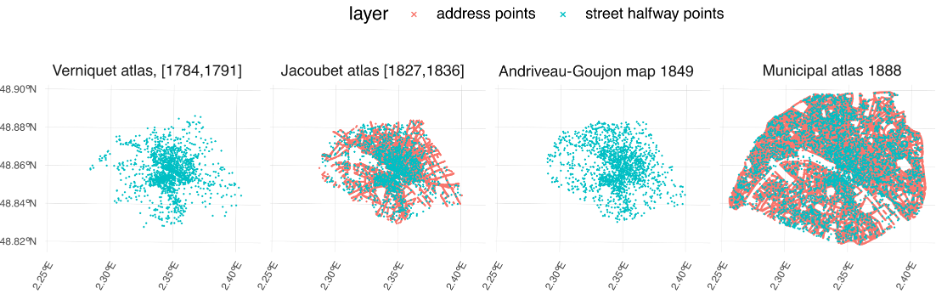
The resulting gazetteer contains around 136,500 geographic entities digitized
from four maps and atlases of Paris (Figure 9). 94% are address points with
their number and street name; the remaining 6% are named streets, approximated
by their halfway point. Each geographic entity is anchored temporally by a time
interval corresponding to the survey period of the source map, or to the
publishing date if the survey period is unknown. Thus, the information of the
gazetteer is time-dependent. Figure 9 represents the gazetteer and its entities
clustered in time according to the production periods of the four maps and
atlases. Each depicts Paris at different phases of its morphological evolution:
on the eve of the Revolution for the Verniquet atlas, in the 1830s after the
phase of national property subdivision for the Jacoubet atlas, before the
Second French Empire for the Andriveau-Goujon map, and after the major
Haussmanian transformations for the Municipal atlas.
The atlases focus on the area within the administrative boundaries of Paris,
i.e. within the Fermiers généraux limits
before 1860, and Thiers wall after that date. However, numbering inside the
administrative limits is only partial. In the Jacoubet atlas for example, the
zone between the boulevards and the Fermiers
généraux wall is mostly urbanized, yet address points are very
sparse. We are faced here with the discrepancies of these cartographic sources,
which combine multiple, heterogeneous administrative sources, possibly
partially out of sync with the exact historic reality of urbanization. In
addition, the suburbs of Paris prior to 1860 are not included in the current
state of the gazetteer.
8.1.2. Geocoding operation
All addresses identified in the directory entries are automatically geocoded.
For this purpose, the open-source geocoding software Pelias
[14] has been adapted to make it time-sensitive. The geocoder is built
around the ElasticSearch indexing and search engine
[15]. It is an adaptation of [
Cura et al. 2018] for ElasticSearch to
improve the performance and accuracy of the process. We refer to this paper for
the methodological and technical details on spatio-temporal geocoding.
A “spatio-temporal” geocoding query consists of the name of the address to
be located, a geographical level (street or address point) and a target date.
The geocoder searches for potential candidates within the gazetteer and orders
them by combining the similarity of their address name with the query and a
time distance value between the query date and the temporality assigned to the
gazetteer entity.
8.2. Building a research sub-corpus of address lists from specific
directories
8.2.1. Five commercial periods of Parisian directories
Parisian directories are commercial editions, involving competition between
publishers, buy-outs over time and moments of editorial monopoly. We revealed
five main periods thanks to the inventory of directories [
Baciocchi and Cristofoli 2022]. The years 1780–1793 are those of the origins. It
was followed by the emergence of the
Almanach du commerce (1798–1815). Competition was fierce, and
publications abounded until 1856, when the Firmin-Didot brothers bought the
Bottin publishing company. Thereafter, the period 1857–1890 was characterized
by the hegemony of the Didot-Bottin collection, before a new period of
competition began in 1891 and lasted until 1914.
The number of copies produced by editors grew through time. It shows how
directories were received and the importance of the enterprise: La Tynna
published 4,500 copies in 1816; Bottin 9,000 in 1840; Firmin-Didot brothers
18,000 in 1857, and 45,000 in 1878. The latter wrote in their 1857
introduction:
“to judge the importance of such a
publication by a single material fact, one need only say that, for the
eighteen thousand copies printed, almost all of which are sold with binding,
it is necessary, because of the size of the volume, for a flock of several
thousand sheep to provide their hides each year for this bookbinding”
[
Firmin-Didot and Firmin-Didot 1857, p. 8, our translation].
8.2.2. Selection criteria of alphabetical lists in directories
At the beginning of the 19th century, alphabetical lists included prominent
inhabitants, while professional lists featured merchants. In 1817, editor La
Tynna alphabetically listed merchants but maintained a separate alphabetical
address list for each population. Consequently, the alphabetical lists used for
the study are not comparable in terms of social coverage before and after the
end of the 1810s. We could incorporate the professional lists spanning from
1787 to 1816 in our sub-corpus to extend the temporal scope of the study.
However, we have recently extracted the data for these lists and have chosen to
focus solely on the alphabetical lists, of which we have a more comprehensive
understanding.
The publisher Bottin merged both alphabetical lists (merchants and prominent
inhabitants). We wish to begin the study period in 1820, one year after
Bottin’s first publication and the first year for which we have a digitized
version. However, at that date, the alphabetical list of merchants in the
Bottin directory contained a system of cross-references to the pages of the
list by profession. During the NER phase, page references were identified as
street numbers, generating noise during the geocoding phase. Consequently, we
have decided to start the study period in 1822, when Bottin’s cross-referencing
system was no longer in use.
8.2.3. Selection criteria of peculiar years
High-quality digital versions of directories are not consistently available.
For instance, the year 1830 lacks a suitable digital version, prompting us to
select the 1829 Bottin directory instead [
Cristofoli and Baciocci 2024].
Additionally, we wish to study identical collections over time whenever
possible, as their content is more uniform compared to different series and
collections. For example, we have access to the Didot-Bottin collection from
1860 onward and we have chosen the year 1909 instead of 1910. Indeed, there is
no high-quality digital version for the 1910 Didot-Bottin directory, whereas
one is available for 1909 and yet a processed version of the 1910
Paris-Hachette directory.
8.3. Evaluation of the geocoding
8.3.1. From initial data to distinct addresses and distinct geolocated
addresses points: an example
A list of ten directory entries in “rue
Sainte-Croix-de-la-Bretonnerie” (Figure 10, top table and map,
\(e = 10\)), selected from
the Didot 1845 directory, helps to explain the definitions used in the paper
and the following indicators.
The named entity recognition (NER) processing shows that these 10 entries
contain 8 addresses (\(a =
8\)), defined as character strings combining address.name and address.number. Indeed, the
address of “Rousselle, pharmac. en chef au
Val-de-Grâce” does not exist in the original source and a NER
detection problem had truncated the original entry “George,
bonneterie et nouveautés, Rochechouart, 10 [4]”. An address is
geolocated if the geocoding process is able to match the character string of
the address with the gazetteer (i.e. when geocoding.has_geocoding is true). In this example, 7 addresses are
geolocated with the Jacoubet atlas (\(ga
= 7\)), and “Baril-lerie, 7” was not
found in the gazetteer.
The “distinct addresses” of a directory, shown in the second table in
Figure 10, refer to all the unique character strings tagged as addresses by the
NER (\(da = 6\)). Two strings
that are close but slightly dissimilar are considered as different addresses
whenever a small variation appears, as in the case of “Ste-Croix-de-la-Bretonnerie, 54” and “Ste-Croix-Bretonnerie, 54”.
Finally, the distinct geolocated addresses refer to unique point geometries
associated with the directory entries (see section 4.1 for an extended
definition). Here, in the bottom table of Figure 10, 4 distinct geolocated
addresses had been found (\(dga =
4\)).
8.3.2. Overall evaluation
The evaluation of the geocoding process for each of the directories is
presented in Figure 11. Three main points stand out in the table.
Firstly, the ratio of the number of addresses per number of entries is always
greater than 1 (see \(a/e\) in
Figure 11), and mainly between 1.05 and 1.2, because individuals can have an
activity at several addresses. Two typical cases exist: On one hand, the
directory lists the place of manufacture and the place of sale of an
individual, or the various store units of an individual; on the other hand, a
store has two addresses because it is located at a crossroad and its storefront
faces two streets.
Secondly, the geocoding of addresses is systematically higher than 89.1% – as
shown with ratio \(ga/a\). On
average 95.7% of addresses are geocoded, varying from 89.1% to 98.2%.
Thirdly, the geocoding of distinct addresses is very good. Indeed, the ratio of
distinct geolocated addresses per distinct addresses is between 0.966 and 0.99
(see \(dga/da\) in Figure
11).
8.3.3. Evaluation of the geocoding in the edges of the city in 1845
There is no cartographic source of addresses in the gazetteer for areas outside
the Fermiers généraux wall before the 1860
extension of Paris. Entries located outside the Fermiers
généraux wall in the 1845 directory are therefore mostly
geolocated with the 1888 Municipal atlas. However, the urban fabric of Parisian
edges between the pre- and post-1860 underwent dramatic changes, and the
geocoding is less accurate here than in the city center.
A meticulous manual study of the addresses geolocated in these areas in 1845
reveals various problems in the outcome of the SoDUCo automated pipeline chain
(Figure 12 and 13).
Leaving aside complete failures of the geocoding processing caused here by a
myriad of peculiar forms in the addresses extracted from the directories, three
typical borderline cases can be identified and summarized:
-
Erroneous NER. Bad geolocations are linked to poor or
imperfect recognition of entities by the NER. This is easily identifiable
when the address text is made up of weird character strings or irrelevant
words. But it can be more difficult to detect when the false-address is
plausible enough to be associated with an address in the gazetteer. The
geocoder provides a procedure for excluding some identifiable cases (custom_catchall_alwaysvalid in Figure 12), but
incorrect parsing raises the question of how to handle complex address
descriptions, which can sometimes be fragmented into several directory
addresses.
-
Incorrect street name in the directory. In few cases,
the directory itself provides incorrect information, which has an impact on
the geocoding processing (mainly spelling mistakes and typos).
-
Street absent in the gazetteer. Sometimes the gazetteer
is incomplete or inaccurate. Some streets, attested by their frequency of
appearance in a directory, are not present in the gazetteer (e.g. Napoléon
quay). In other cases, streets are present but without numbers. In this
case, the geocoding process may favor another gazetteer offering addresses,
even if the temporal consistency loses quality.
8.4. The dynamics of commercial and wealthy areas of the Petit Montrouge
district in 1900-1904 (14th arrondissement)
Figure 8 shows that the density of geolocated addresses on five hexagons located
in the Petit Montrouge district, south of Paris in the 14th arrondissement, fell
sharply between 1900 and 1904 compared to the whole Paris area (green hexagons in
Figure 8). In order to better understand these spatial dynamics, we examine each
entry from the 1900 Didot-Bottin directory list in this district that is missing
from the 1904 list.
There are 222 directory entries corresponding to the 193 different geolocated
addresses in the study area (Figure 14). We analyze each entry to determine
whether or not it is possible that the disappearance of geolocated addresses
between 1900 and 1904 may be the result of the publication of the Bottin mondain, i.e. an individual no longer appears in the
general list because he or she has been included only in the Bottin mondain by the editors.
A previous study of the Didot-Bottin directories shows that the entries which
disappear from the general lists after 1903 are mainly those of individuals
designated as owners and annuitants, and to a lesser extent, those affiliated with
public administration, e.g. deputies, directors of an institution, etc. [
Gravier and Barthelemy 2024]. We therefore hypothesize that the 1900 entries
referring to owners, annuitants or churchmen are most likely included in the
Bottin mondain in 1904 (N=45
geolocated addresses, in red in Figure 14). However, this is impossible if they
refer to small merchants or craftsmen (N=120, in blue in Figure 14). For other
professions, such as intellectuals (N=19, in orange), this possibility remains
open.
The cartographic result of this systematic qualitative study, presented in Figure
14, shows a significant north/south differentiation between the five hexagons in
sharp decline initially identified in Figure 8. Indeed, geolocated addresses
present in the 1900 directory and no longer present in 1904 mainly refer to small
craftsmen and merchants in the three northern hexagons (see blue dots in Figure
14), while they tend to be owners in the two southern hexagons (see red dots). The
decrease in the density of geolocated addresses in this district is probably due
to an important reorganization of the economic fabric in the north, combine with
the source effect of the publication of the Bottin mondain in the south.
8.5. Parisian directories data access points
Four ways of accessing Paris directories data have been developed, as shown in
Figure 15. Open tabular and spatial datasets supported by documentation that can
be downloaded from the Nakala data archive repository, developed by Huma-Num
infrastructure of the French National Center for Scientific Research (CNRS) [
GeoHistoricalData 2023]; a IIIF viewer
[16] for displaying one or more directory lists with the results of OCR and
NER, and allowing page-by-page downloading of the data displayed; an API REST for
direct querying the PostgreSQL database
[17]. All these services are hosted by the CC-IN2P3 of the CNRS.
Works Cited
Abadie et al. 2022 Abadie, N., et al. (2022)
“A benchmark of named entity recognition approaches in historical
documents application to 19th Century French directories”, in S. Uchida, E.
Barney, and V. Eglin (eds)
Document Analysis Systems.
Cham: Springer International Publishing (Lecture Notes in Computer Science), pp.
445–460. Available at:
https://doi.org/10.1007/978-3-031-06555-2_30.
Åhlfeldt, Berman, and Wick 2016 Åhlfeldt, J., Berman, M.L. and Wick, M. (2016) “Historical
Gazetteer System Integration: CHGIS, Regnum francorum Online, and
GeoNames”, in M.L. Berman, R. Mostern, and H. Southall (eds) Placing Names: Enriching and Integrating Gazetteers.
Bloomington: Indiana University Press (The Spatial Humanities), pp. 110–125.
Albers and Kappner 2023 Albers, T.N.H. and Kappner,
K. (2023)
“Perks and pitfalls of city directories as a
micro-geographic data source”,
Explorations in
Economic History, 87, p. 101476. Available at:
https://doi.org/10.1016/j.eeh.2022.101476.
Andriveau-Goujon 1868 Andriveau-Goujon, E.
(1868)
“Plan d'ensemble des travaux de Paris à
l’échelle de 0,001 pour 10 mètres (1/10 000) indiquant les voies exécutées et
projetées de 1851 à 1868”. Paris: E. Andriveau-Goujon. Available at:
http://gallica.bnf.fr/ark:/12148/btv1b530068310(Accessed: 25 February
2024).
Baciocchi and Cristofoli 2022 Baciocchi, S. and
Cristofoli, P. (2022)
“Inventaire des ouvrages
proposant des listes d'adresses parisiennes entre 1780 et 1914”. Available
at:
https://shs.hal.science/halshs-04526443(Accessed: 25 July
2024).
Barthelemy et al. 2013 Barthelemy, M. et al.
(2013)
“Self-organization versus top-down planning in the
evolution of a city”,
Scientific Reports,
3(1), p. 2153. Available at:
https://doi.org/10.1038/srep02153.
Bell et al. 2020 Bell, S. et al. (2020)
“Automated data extraction from historical city directories: The rise
and fall of mid-century gas stations in Providence, RI”,
PLOS ONE, 15(8), p. e0220219. Available at:
https://doi.org/10.1371/journal.pone.0220219.
Bonvalet and Tugault 1984 Bonvalet, C. and Tugault,
Y. (1984)
“Les racines du dépeuplement de
Paris”,
Population, 39(3), pp. 463–481.
Available at:
https://doi.org/10.2307/1532898.
Bottin 1820 Bottin, S. (1820)
Almanach du commerce de Paris, des départemens de la France et des
principales villes de l’Europe. Paris: bureau de l’Almanach du commerce.
Available at:
https://gallica.bnf.fr/ark:/12148/bpt6k1245624.
Brée 2020 Brée, S. (2020)
La population de la région parisienne au XIXe
siècle, in
Paris, l’inféconde : La
limitation des naissances en région parisienne au XIXe siècle. Paris: Ined
Éditions (Études et enquêtes historiques). Available at:
http://books.openedition.org/ined/1496(Accessed: 16 February
2023).
Carr, Olsen, and White 1992 Carr, D.B., Olsen, A.R. and
White, D. (1992)
“Hexagon Mosaic Maps for Display of Univariate
and Bivariate Geographical Data”,
Cartography and
Geographic Information Systems, 19(4), pp. 228–236. Available at:
https://doi.org/10.1559/152304092783721231.
Cottereau 1997 Cottereau, A. (1997)
“The fate of collective manufactures in the industrial world: the
silk industries of Lyons and London, 1800–1850”, in C.F. Sabel and J.
Zeitlin (eds)
World of Possibilities: Flexibility and Mass
Production in Western Industrialization. Cambridge: Cambridge University
Press (Studies in Modern Capitalism), pp. 75–152. Available at:
https://doi.org/10.1017/CBO9780511563652.003.
Cristofoli and Baciocci 2024 Cristofoli, P. and
Baciocchi, S. (2024)
“Distribution annuelle des
principales collections et séries d'ouvrages proposant des listes d’adresses
parisiennes (1780-1914) avec mention de la disponibilité d’une version numérique
librement accessible de chaque ouvrage et des sources cartographiques et types de
numérotation associées à la période”. Available at:
https://shs.hal.science/halshs-04526423
Cura et al. 2018 Cura, R. et al. (2018)
“Historical collaborative geocoding”,
ISPRS International Journal of Geo-Information, 7(7), pp. 1–29. Available
at:
https://doi.org/10.3390/ijgi7070262.
Daras, Feng, and Dibben 2015 Daras, K., Feng, Z. and
Dibben, C. (2015) “HAG-GIS: A spatial framework for geocoding
historical addresses”, in. GIS RESEARCH UK 2015:
Annual Conference University of Leeds, Leeds.
de Maupeou and Saint-Raymond 2013 de Maupeou, F. and Saint-Raymond, L. (2013) “Les “marchands de tableaux” dans le Bottin du commerce: une approche
globale du marché de l’art à Paris entre 1815 et 1955”, Artl@s Bulletin, 2(2), p. Article 7.
Denis 2015 Denis, V. (2015)
“The
Parisians, the police and the house numbering, from the 18th century to the
Empire”,
French Historical Studies, 38(1), pp.
83–103. Available at:
https://doi.org/10.1215/00161071-2822709.
di Leonardo et al. 2019 di
Leonardo, I. et al. (2019)
“Repopulating Paris: Massive
extraction of 4 Million addresses from city directories between 1839 and
1922”, in
Digital Humanities conference
DH2019. Utrech: Utrech University. Available at:
https://doi.org/10.34894/MNF5VQ.
Evangelista and Beskow 2018 Evangelista, P.F.
and Beskow, D. (2018) “Geospatial point density”, The R Journal, 10(2), pp. 347–356.
Faure 2004 Faure, A. (2004)
“Spéculation et société: les grands travaux à Paris au XIXe
siècle”,
Histoire, économie &
société, 23e année(3), pp. 433–448. Available at:
https://doi.org/10.3917/hes.043.0433.
Firmin-Didot and Firmin-Didot 1845 Firmin-Didot, A. and Firmin-Didot, H. (1845)
Annuaire général du commerce, de l’industrie, de la magistrature et de
l’administration. Paris: Firmin-Didot frères. Available at:
https://gallica.bnf.fr/ark:/12148/bpt6k6292987t.
Firmin-Didot and Firmin-Didot 1857 Firmin-Didot, A. and Firmin-Didot, H. (1857)
Annuaire-almanach du commerce, de l’industrie, de la magistrature et de
l’administration: ou almanach des 500.000 adresses de Paris, des départements et
des pays étrangers: Firmin Didot et Bottin réunis. Paris: Firmin-Didot
frères. Available at:
https://gallica.bnf.fr/ark:/12148/bpt6k6305463c/.
Firmin-Didot and Firmin-Didot 1903 Firmin-Didot, A. and Firmin-Didot, H. (1903)
Annuaire-almanach du commerce, de l’industrie, de la magistrature et de
l’administration : ou almanach des 500.000 adresses de Paris, des départements et
des pays étrangers : Firmin Didot et Bottin réunis. Paris: Firmin-Didot
frères. Available at:
https://gallica.bnf.fr/ark:/12148/bpt6k3208950j.
Frondizi 2018 Frondizi, A. (2018) Paris au-delà de Paris : urbanisation et révolution
dans l’outre-octroi populaire, 1789-1860. PhD Thesis. Paris: Institut d’études
politiques de Paris - Sciences Po.
GeoHistoricalData 2023 GeoHistoricalData
(2023)
“Annuaires historiques parisiens, 1798-1914.
Extraction structurée et géolocalisée à l'adresse des listes nominatives par ordre
alphabétique et par activité dans les volumes numérisés”. NAKALA. Available
at:
https://doi.org/10.34847/nkl.98eem49t.
Grange 1996 Grange, C. (1996) Les gens du Bottin mondain: y être, c'est en être. Paris,
France: Fayard.
Gravier and Barthelemy 2024 Gravier, J. and
Barthelemy, M. (2024)
“A typology of activities over a century of
urban growth”,
Nature Cities, 1(9), pp.
567–575. Available at:
https://doi.org/10.1038/s44284-024-00108-7.
Gribaudi 2009 Gribaudi, M. (2009)
“Ruptures et continuités dans l'évolution de l’espace
parisien. L’îlot de la Trinité entre les xviiie et xixe siècles”,
Histoire & mesure, XXIV(2), pp. 181–220.
Available at:
https://doi.org/10.4000/histoiremesure.3959.
Gribaudi 2014 Gribaudi, M. (2014) Paris ville ouvrière: une histoire occultée,
1789-1848. Paris, France: La Découverte.
Gribaudi and Blum 1990 Gribaudi, M. and Blum, A.
(1990)
“Des catégories aux liens individuels :
l'analyse statistique de l’espace social”,
Annales. Économies, Sociétés, Civilisations, 45(6), pp.
1365–1402. Available at:
https://doi.org/10.3406/ahess.1990.278914.
Gribaudi and Blum 1993 Gribaudi, M. and Blum, A.
(1993)
“Les déclarations professionnelles.
Pratiques, inscriptions, sources”,
Annales. Économies, Sociétés, Civilisations, 48(4), pp. 987–995.
Available at:
https://doi.org/10.3406/ahess.1993.279186.
Grossner and Mostern 2021 Grossner, K. and Mostern,
R. (2021)
“Linked Places in World Historical Gazetteer”,
in
Proceedings of the 5th ACM SIGSPATIAL International Workshop
on Geospatial Humanities. New York, NY, USA: Association for Computing
Machinery (GeoHumanities ’21), pp. 40–43. Available at:
https://doi.org/10.1145/3486187.3490203.
Hedefalk et al. 2018 Hedefalk, F. et al. (2018)
“Importance of the geocoding level for historical demographic
analyses: A Case Study of rural parishes in Sweden, 1850–1914”,
Spatial Demography, 6(1), pp. 35–69. Available at:
https://doi.org/10.1007/s40980-017-0039-7.
Hersent et al. 2023 Hersent, M. et al. (2023)
“Modèles et outils pour la publication de métadonnées
d'archives géographiques et de leurs données dérivées”, in
Humanistica 2023. Genève, Switzerland: Association francophone des humanités numériques
(Modélisation de données). Available at:
https://hal.science/hal-04110787.
Jordan 1995 Jordan, D.P. (1995) Transforming Paris: the life and labors of Baron Haussmann. Chicago:
University of Chicago Press.
Lan and Longley 2019 Lan, T. and Longley, P. (2019)
“Geo-Referencing and mapping 1901 Census Addresses for England
and Wales”,
ISPRS International Journal of
Geo-Information, 8(8), p. 320. Available at:
https://doi.org/10.3390/ijgi8080320.
Larroque and Jigaudon 1980 Larroque, D. and
Jigaudon, G. (1980)
“Industrialisation et
équipements urbains à Paris. 1830-1914”,
Les Annales de la Recherche Urbaine, 8(1), pp. 49–86. Available at:
https://doi.org/10.3406/aru.1980.998.
Montel 2012 Montel, N. (2012)
“L'agrandissement de Paris en 1860: un projet controversé”, in
F. Bourillon and A. Fourcaut (eds)
Agrandir Paris
(1860-1970).
Paris: Éditions de la Sorbonne
(Histoire contemporaine), pp. 99–111. Available at:
https://doi.org/10.4000/books.psorbonne.2393.
Openshaw 1983 Openshaw, S. (1983) The modifiable areal unit problem. Norwick [Norfolk]: Geo
Books (Concepts and Techniques in Modern Geography (CATMOG), 38).
OpenStreetMap contributors 2024 OpenStreetMap
contributors. (2024)
“Planet dump retrieved from
https://planet.osm.org”. Available at:
https://www.openstreetmap.org.
Pearce et al. 2018 Pearce, J. et al. (2018)
“Life course of place: A longitudinal study of mental health and
place”,
Transactions of the Institute of British
Geographers, 43(4), pp. 555–572. Available at:
https://doi.org/10.1111/tran.12246.
Peuquet 1984 Peuquet, D. (1984)
“A conceptual framework and comparison of spatial data models”,
Cartographica: The International Journal for Geographic Information
and Geovisualization, 21(4), pp. 66–113. Available at:
https://doi.org/10.3138/D794-N214-221R-23R5.
Pronteau 1966 Pronteau, J. (1966) Les numérotages des maisons de Paris du XVe siècle à nos jours. Paris: Préfecture de la Seine, Service des travaux historiques.
Rose-Redwood and Tantner 2012 Rose-Redwood, R.
and Tantner, A. (2012)
“Introduction: Governmentality, house
numbering and the spatial history of the modern city”,
Urban History, 39(4), pp. 607–613. Available at:
https://doi.org/10.1017/S0963926812000405.
Sanders 2021 Sanders, L. (2021)
“Introduction: A collective and interdisciplinary project on the transitions in
settlement systems”, in Lena Sanders (ed.)
Settling
the World: From Prehistory to the Metropolis Era. Tours: Presses
universitaires François-Rabelais (Perspectives Villes et Territoires). Available at:
https://doi.org/10.4000/books.pufr.19685(Accessed: 29 February
2024).
Varet-Vitu, Marraud, and Mermet 2020 Varet-Vitu, A., Marraud, M. and Mermet, É. (2020)
“Spatialités sociales à Paris à la veille de la
Révolution. Les apports d'un système d’information géographique”,
Histoire Urbaine, 58(2), pp. 157–186.
Available at:
https://doi.org/10.3917/rhu.058.0159.